
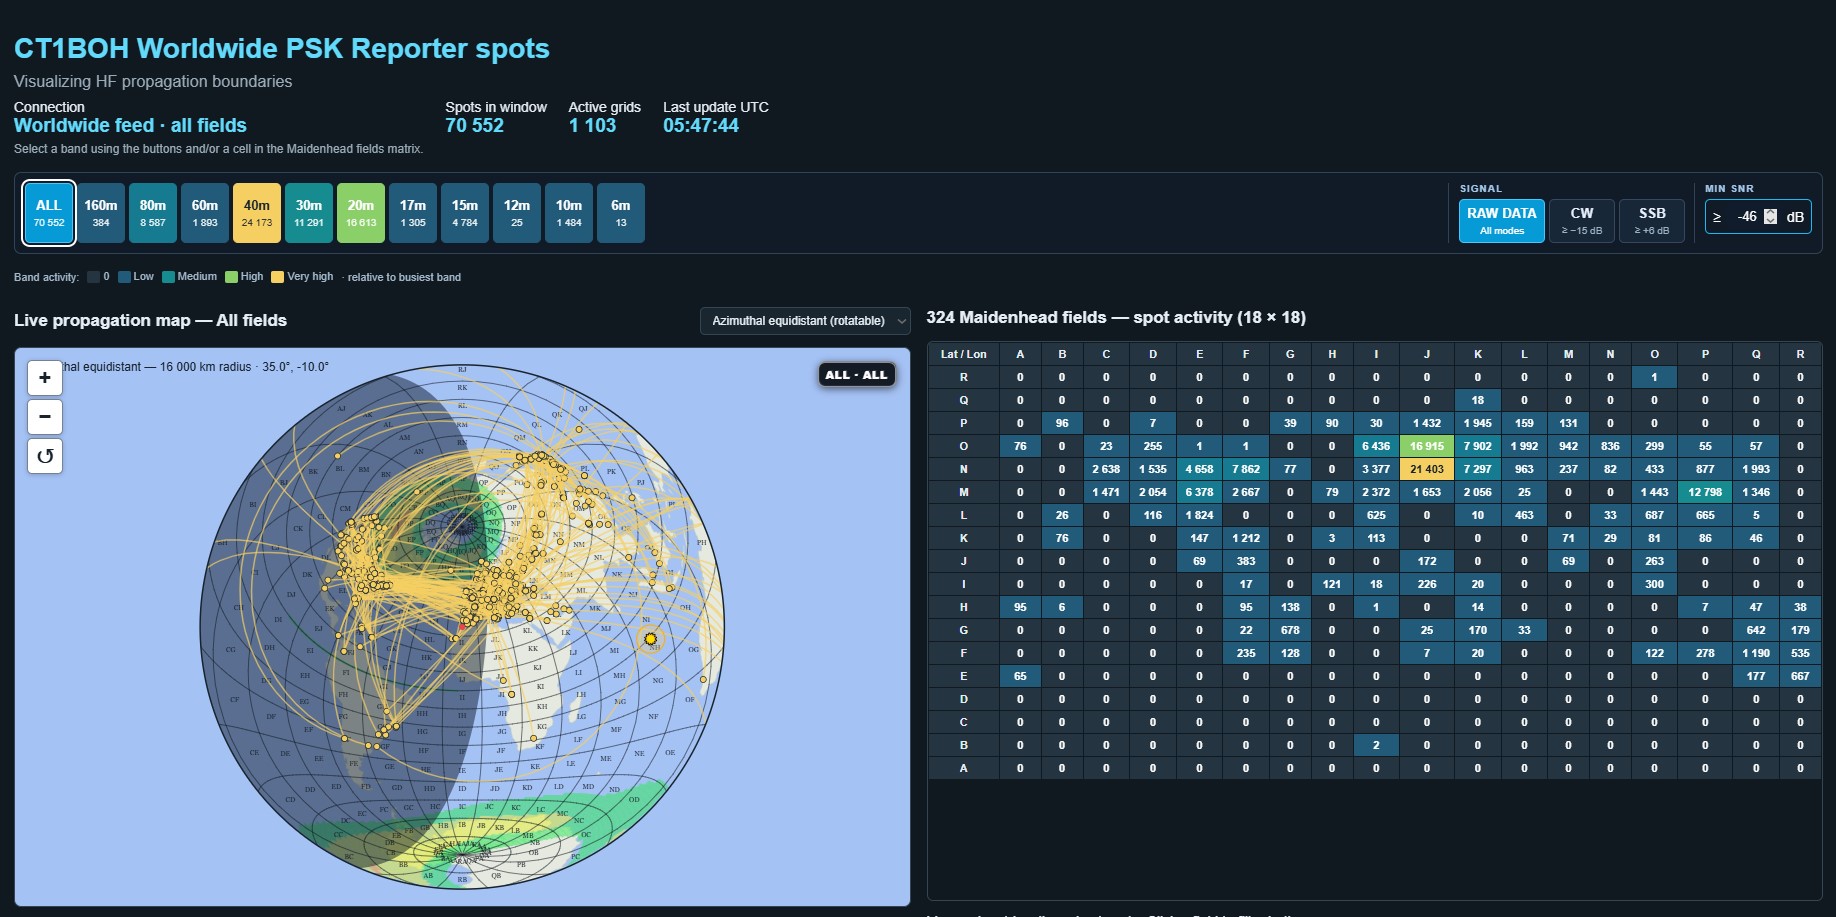
José Nunes CT1BOH, multiple CQ WW winner and world record holder in the SOAB CW category, created a web tool to visualize worldwide data from PSK Reporter. This is not another mirror view of pskreporter.info, but its own analytical layer - the tool takes spots in real time via MQTT, sorts them into a matrix of 324 Maidenhead fields (18 × 18) and plots them on an interactive map with links between the source and the receiver. The result is a view of KV spread that goes beyond individual spots and shows the global structure of promotion.
You will read in the article
Spot processing methodology
The system works with time windows of 5, 15, 30 and 60 minutes. Each spot is counted once in the transmitter's field and once in the receiver's field - so it is counted twice within one field. The important thing is that these are not unique QSOs, but raw reports, which with a larger number of stations in one field increases the data density and thus also the informative value for the analysis of the direction of propagation. Directional paths (for example EM → FN and vice versa FN → EM) are tracked independently. Only routes with three or more spots are drawn on the map - this eliminates random noise and only statistically relevant routes are displayed.
Identification of open bands
Switching between bands reveals which routes are currently active. The band activity scale (Low to Very high) is relative to the busiest band, which allows a quick comparison. The filtering mode offers a raw display of all modes, a CW filter (minimum SNR −15 dB) and an SSB filter (minimum SNR +6 dB). The custom SNR threshold allows you to simulate what a lower power station or a simple antenna would pick up - practically useful for QRP operators who want to know if a given band offers a real chance of connection or is only open to powerful stations.
Map projections and geophysical layers
The tool offers Mercator projection and rotatable azimuthal equidistant projection with a radius of up to 20,000 km. The azimuth view is more natural for the radio amateur - it shows distances and directions as the operator perceives them from his own QTH. Overlays include a real-time day/night terminator, NOAA OVATION aurora forecast in four levels (Low to Very high), and D-layer absorption from NOAA DRAP with bands 0–2, 2–5, 5–10, and above 10 MHz. The combination of spots with a glow forecast makes it possible to identify when the absence of connections on routes through the polar region is not due to poor propagation, but absorption in the ionosphere.
Comparison with ionospheric models
Integrating DRAP data directly into the spot map creates an opportunity to compare empirical results with theoretical predictions. If DRAP shows absorption above 10 MHz on northern routes and the map simultaneously lacks spots on 20 m towards Scandinavia, the model and reality match. More interesting are the situations where they do not match - the spots exist despite the predicted absorption, which may indicate reflection from higher layers of the ionosphere bypassing the D-layer. For the operator with a directional antenna, this is a signal that a connection is possible despite a pessimistic forecast, especially if he concentrates on the correct Azimuth and Elevation angle.
Contest and DX size
It is for the contest station CT1BOH Worldwide PSK Reporter spots usable as a supplement to the traditional bandscope and DX cluster. The five-minute window shows the current status – what routes are currently open and where the signals are going. The sixty-minute window reveals the trend: is the band opening or closing? A combination of both helps in deciding when to switch to another band. The directional filter (TX only / RX only) makes it possible to distinguish whether the path is passable in both directions or only one - asymmetric propagation is common on KV bands and its timely identification saves time when calling stations that cannot hear the operator. Route audit sorted by number of spots directly shows the most active routes, which helps the DXman orient himself to the directions with the highest probability of success.