
After the contest, the radio amateur will have a lot of data in the log that often gets lost during actual operation QSO. Značky, lokátory, časy, vzdialenosti, RST, odovzdané a prijaté čísla či pásmo však môžu poslúžiť na podrobnejšiu analýzu. PD4R Post contest Tool is a web tool designed specifically for processing completed contest logs. It allows creating an overview of the number of QSO, QRB, DXCC, grid square, časovom priebehu aj jednotlivých spojeniach.
In the article, you will read
PD4R Post Contest Tool – na čo slúži
The basic idea of the tool is to analyze data that has already been recorded during the contest. It is not a contest logger intended for recording connections during operation, but a tool for subsequent evaluation of the log. The user enters their callsign and home locator and can then load files in TXT or EDI format. There is also an option to load a previously saved session in JSON format.
Loading and processing contest log
Po načítaní logu nástroj pracuje s údajmi jednotlivých QSO a vytvára z nich ďalšie prehľady. Zaujímavé je, že okrem agregovaných štatistík zostáva k dispozícii aj detailná tabuľka spojení. To umožňuje prejsť od celkového pohľadu na contest až ku konkrétnemu QSO a skontrolovať údaje, z ktorých boli štatistiky vypočítané.
Basic contest statistics
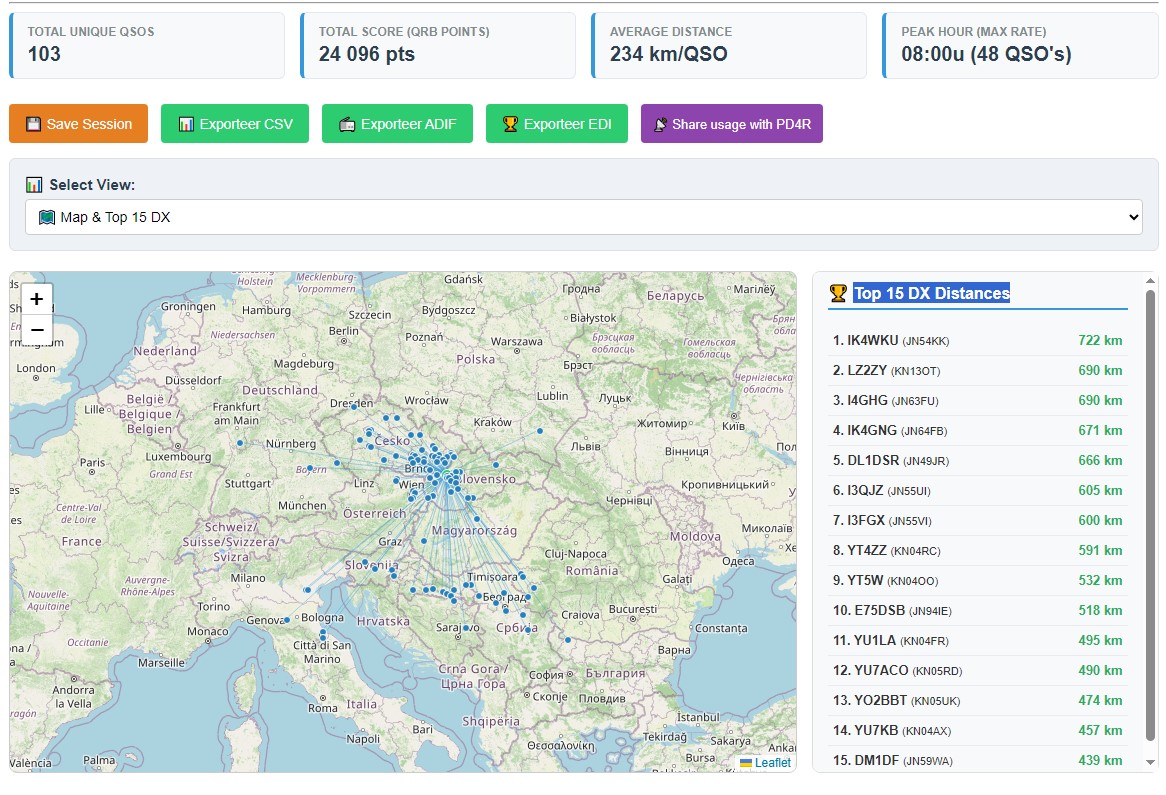
The first information is provided by a quartet of basic indicators. The tool displays the total number of unique QSO, the total number of QRB points, the average distance per QSO, and the maximum hourly rate. Together, they provide a quick picture of what the result was in terms of the number of connections, points earned, average QRB, and intensity of operation.
| Indicator | Meaning |
| Unique QSO | Number of unique connections in the processed log |
| QRB points | Total sum of points derived from distance |
| Average distance | Average QRB per QSO |
| Max Rate | Highest achieved hourly QSO count |
Longest connections and QRB distribution

The separate section Top 15 DX Distances displays the fifteen longest connections. The tool also offers playback control and speed selection. This allows tracking the progress of the longest connections in relation to the contest. When analyzing the results, the distance distribution table is also useful. It contains individual QRB categories, number of QSO, percentage representation, and the share of that category on points earned.
This perspective may be more interesting than the average QRB itself. Two stations may have a similar number of QSOs but completely different distance distributions and thus different point contributions from individual groups of connections.
DXCC and grid square

PD4R Post Contest Tool rozdeľuje spojenia aj podľa pracovaných DXCC. Pri jednotlivých položkách zobrazuje počet QSO a volacie značky, ktoré boli v danej DXCC entite zaznamenané. Samostatne je k dispozícii prehľad pracovaných lokátorvých štvorcov, pričom nástroj používa štvormiestne lokátory. Pri VHF a UHF contestoch môže byť práve geografické rozloženie lokátorov dôležitým doplnkom k samotnému počtu QSO.
Ako sa contest vyvíjal v čase
The time course of QSO is available in the QSO overview by UTC hours. From the log, one can track during which hours the activity was most intense and how the number of connections changed during the contest. Combined with the data on maximum hourly rate, it is a simple way to retrospectively assess the use of time during the competition.

For the radio amateur, this view can also be useful when comparing multiple contests. If a similar time course appears in other logs, it may indicate a regular pattern of operation. However, the tool does not determine the causes of changes; it provides data derived from the processed log.
Detailed QSO table and log check
At the end of the overview is a table of individual QSOs. It includes the date, time in UTC, call sign, locator, distance, RST Tx/Rx, Tx/Rx numbers, band, mode, and source of the record. This is practical not only for statistical analysis but also for checking specific log items.
In detailed checks, it is not necessary to stay only with aggregated graphs. If, for example, the result looks unusual, individual QSOs can be found directly in the table and compared by their time, locator, QRB, or other recorded data.
Export results and practical use
Results can be exported from the tool in CSV, ADIF, and EDI formats. It is also possible to save the working session separately and later reload it in JSON format. Thus, the tool does not have to serve only for a one-time display of results but can be part of subsequent processing of contest data.
Praktický postup je jednoduchý: po contestovom víkende načítať EDI alebo TXT log, skontrolovať základné štatistiky, pozrieť si rozdelenie QRB, najdlhšie spojenia, DXCC a lokátory a následne analyzovať časový priebeh. Detailná tabuľka QSO umožní v prípade potreby vrátiť sa ku konkrétnym spojeniam a výsledky možno ďalej exportovať.
Conclusion
Contestový log nie je iba súbor potrebný na odovzdanie výsledkov. Obsahuje dáta, z ktorých sa dá spätne zistiť oveľa viac o priebehu prevádzky. PD4R Post Contest Tool This data is made available in the form of basic statistics, QRB analysis, DXCC and grid overviews, time courses, and a detailed list of QSOs. For the radio amateur who wants to compare their own operations after contests and better understand what actually happened during the races, such subsequent analysis is a useful complement to the contest log itself.