
For decades, measuring and optimizing antenna systems, filters, and high-frequency (HF) circuits was the domain of expensive laboratory instruments. The average radio amateur had to rely on classic PSV meters, noise bridges, or later expensive scalar antenna analyzers. However, these provided only limited information – they measured only the amplitude of the reflected signal, while the phase remained an unknown quantity. However, without phase information, it is impossible to accurately determine the complex impedance and design the optimal match. The advent of the NanoVNA instrument marked a complete revolution in measurement technology in the radio amateur community. The pocket-sized vector network analyzer (VNA) made it possible to measure complex impedance, including phase, at a fraction of the price of commercial laboratory instruments.
This article discusses in detail the hardware architecture, technical capabilities and real-world amateur radio applications of the most popular modification of this device – the NanoVNA-H. We will look at how this tiny box works in terms of its internal circuit design, how to calibrate it correctly and how to get the most out of it when reviving equipment in a hamshack and during portable operation.
V článku sa dočítate
Advantages of using NanoVNA-H in amateur radio practice
The main advantage of the NanoVNA-H is that it is a full-featured two-port vector network analyzer. Unlike conventional antenna analyzers that only measure standing wave ratio (SWR) or gross impedance on one port, the NanoVNA-H simultaneously measures reflection characteristics (designated as S11) on CH0 port and transmission characteristics (designated as S21) on CH1 port.

For the licensed radio amateur and technical enthusiast, this brings the following key benefits:
- Comprehensive impedance display: The device not only measures the absolute value of the impedance |Z|, but can also accurately separate the real component (resistance R) from the imaginary component (reactance X). This allows you to immediately see whether the antenna is too long (inductive character, +jX) or too short (capacitive character, -jX). This dramatically speeds up the resonance setting.
- Visual analysis via Smith chart: The Smith chart displayed directly on the display allows you to immediately understand which direction the antenna resonance is heading and how to design the correct matching circuit, whether it is an L-element, transformer or balun. The chart displays the complex reflection coefficient and helps to accurately visualize capacitive and inductive components across the entire frequency spectrum.
- Simultaneous measurement of two gates: When building filters or coaxial switches, you can monitor both the input return loss (S11) and the insertion loss and filter bandwidth (S21) on one screen. This is completely impossible with a classic antenna analyzer.
-
NanoVNA-H from the top Extreme mobility and autonomy: Thanks to the built-in battery and compact dimensions, the device is ideal for working directly on an antenna mast, when setting up anchored dipoles in the field, or for temporary amateur radio activities such as SOTA, POTA and VHF/UHF contests on hills.
- Integration with PC and simulation software: The ability to export measured data to the standardized Touchstone format (.s1p and .s2p) opens the door to advanced antenna and circuit modeling in programs such as MMANA-GAL, 4NEC2, or professional RF simulators. This allows you to simulate the matching of a real antenna before you buy the material for the matching circuit.


The creation of NanoVNA-H, the circuit design used and the power supply
The history of this revolutionary device began with a designer who goes by the nickname edy555 on the X network (formerly Twitter). In 2016, he proposed the original open-source concept of a low-cost VNA for his own laboratory and amateur radio purposes. The original design was functional, but it lacked more robust commercial processing, better power management, and better mechanical shielding.
The architecture was later taken over, significantly optimized, and prepared for the mass amateur radio community by a Chinese developer going by the name Hugen (hugen79). The letter “H” in the name NanoVNA-H denotes the hardware revision by Hugen. Hugen modified the schematic, designed a new multilayer printed circuit board, implemented shielding covers, and adapted the device for mass production, thereby starting the global boom of this measuring tool.
Circuit design and block connection
In terms of connectivity, the NanoVNA-H is a brilliant example of minimalist yet highly efficient design. Instead of expensive specialized RF chips found in lab instruments from Keysight or Rohde & Schwarz, it uses off-the-shelf and inexpensive components connected in a thoughtful architecture:
- Control microcontroller: The heart of the device is a 32-bit STM32F072C8T6 processor with an ARM Cortex-M0 core operating at a frequency of 48 MHz. This processor controls the synthesizer, operates the display, reads the touch layer, performs mathematical corrections (calibration matrices) and communicates with the PC via the USB interface in CDC mode (virtual serial port).
- Frequency synthesizer: The proven three-channel programmable clock generator Si5351A serves as the signal source. The direct output of this chip provides a clean square wave signal in the range from 50 kHz to 300 MHz with an excellent dynamic range of better than 70 dB. In order to be able to measure also on higher amateur radio bands (70 cm, UHF), Hugen implemented an advanced algorithm using odd harmonic components (3rd, 5th and 7th harmonics) of the square wave signal from Si5351A. In this way, the measurement range was successfully extended up to 900 MHz, although at the cost of a gradual reduction in dynamic range due to the decreasing amplitude of the higher harmonics.
- Directional bridge and mixers: The reflected signal from the DUT (Device Under Test) is fed through a resistor bridge to a trio of SA612AD dual balanced mixers. These mixers (operating as Gilbert cells) convert the measured high-frequency signal to a low intermediate frequency (in the audio band, typically around 4 to 12 kHz). One mixer processes the reference signal, the second the reflected signal (S11) and the third the transmitted signal (S21).
- Signal Processing (ADC): The analog signal from the low intermediate frequency is digitized using the highly integrated TLV320AIC3204 stereo audio codec via the I2S bus. The processor then performs a Discrete Fourier Transform (DFT) to calculate the exact vector values – the real and imaginary components of the transmitted and reflected signal at each measured frequency point.
- Shielding: One of the key benefits of the "H" version was the installation of solid metal shielding covers directly above the high-frequency section (mixers, bridge and generator). This solution dramatically reduced the penetration of external electromagnetic interference and parasitic emissions from the digital part, thereby rapidly increasing the accuracy and stability of measurements, especially at frequencies above 300 MHz.
Battery and power management
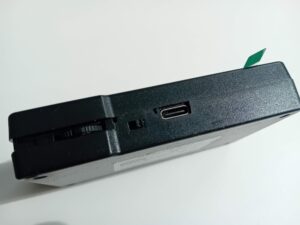
The device contains an integrated charging circuit based on the MCP73831 chip designed for single-cell Li-Po batteries. The Hugen version is equipped with a 400 mAh battery as standard. The current consumption of the device at full display brightness and scanning is around 120-140 mA, which ensures approximately 2.5 to 3 hours of continuous autonomous operation in the field. Charging is via a modern USB type C port from a standard 5 V source, phone charger or power bank. The charging status is indicated by a dedicated LED on the side of the device, where blinking indicates the charging process and steady light indicates a full battery charge.
Detailed technical parameters of NanoVNA-H
The following table summarizes the real hardware and software parameters of the NanoVNA-H device based on the official technical documentation and Hugen's manufacturing specifications:
| Parameters | Value | Note / Technical context |
|---|---|---|
| Motherboard (PCB) dimensions | 54mm × 85.5mm × 11mm | Dimensions without protruding SMA connectors and mechanical switches. |
| Measuring frequency range | 50 kHz to 900 MHz | Baseband up to 300 MHz, higher bands through the 3rd, 5th and 7th harmonic components. |
| RF output power (Port CH0) | -13 dBm (maximum -9 dBm) | Safe, low power to prevent intermodulation and damage to semiconductors. |
| Dynamic range (50 kHz – 300 MHz) | > 70 dB | It uses a direct fundamental frequency from the lowest noise Si5351A synthesizer. |
| Dynamic range (300 MHz – 600 MHz) | > 50 dB | Measurement using the 3rd harmonic component of the signal, slight increase in the noise floor. |
| Dynamic range (600 MHz – 900 MHz) | > 40 dB | Measurement using the 5th and 7th harmonic components requires careful calibration. |
| Custom SWR measurement ports | < 1.1 | Minimizes parasitic reflections on the device's RF connectors themselves. |
| Display | 2.8-inch TFT touch screen | Resolution 320 × 240 pixels, resistive touch layer responsive to stylus. |
| Communication interface | USB Type-C | It is used for power supply, battery charging and full data connection with a PC. |
| Number of scan points (standalone) | 101 points (fixed) | Internal limitation of MCU RAM. When controlled via PC, the number of points is selectable. |
| Frequency stability/error | < 0.5 ppm | Thanks to the integration of a high-quality temperature-compensated oscillator VCTCXO. |
| Internal memory slots (Save/Recall) | 5 positions (0 to 4) | They are used to store complete calibrations for different frequency ranges. |
What measurements is NanoVNA-H suitable for?
The applicability of the NanoVNA-H in the amateur radio hamshack and workshop is extremely wide. The device perfectly replaces several separate single-purpose devices:
Analysis and tuning of antenna systems (Port CH0 – S11)
A basic function for every radio amateur. It allows you to measure the standing wave ratio (SWR) and the reflection coefficient (Return Loss) across the entire selected frequency range. Thanks to the display of the complex impedance on the Smith chart, the operator can accurately determine whether the antenna is in resonance, what its real input resistance is (ideally 50 Ω) and what its reactance is outside of resonance. It is ideal for tuning directional antennas such as yagi, quad, wire dipoles, verticals or magnetic loop antennas.
Characterization of filters and passive RF circuits (Port CH0 and CH1 – S21)

Thanks to the Transmission measurement, it is possible to tune low-pass filters (LPF) behind power amplifiers, bandpass filters (BPF) for transceivers, coaxial notches or duplexers for converters with high accuracy. On the display, you can directly see the real attenuation curve in the passband (Insertion Loss), the ripple in the band and the slope of the suppression of unwanted frequencies in the non-passband.
Measurement of coaxial cables and transmission lines
Using the Time Domain Reflectometry (TDR) function, which is fully supported by the operating PC software, the NanoVNA-H can accurately measure the physical length of a coaxial cable, determine its Velocity Factor at a known length, measure the attenuation of a cable drop at a specific frequency, or precisely locate the location of damage (water in the cable, kink under the insulation, short circuit or interruption of the radiator) with an accuracy of tens of centimeters.
Measurement of baluns, ununs and impedance transformers
By connecting a current or voltage balun (e.g. 1:1, 4:1 or 9:1 for End-Fed Long Wire antennas) to the CH0 port and terminating its output with an appropriate non-inductive resistor, you can verify its actual transformation ratio, operating bandwidth and the quality of the ferrite core used in terms of losses and transformation accuracy to a standard 50 Ω system.
Software extension and connection to PC: NanoVNA-Saver and NanoVNA-App
Although the NanoVNA-H is a fully autonomous device with its own LCD display, the real performance leap occurs after connecting it to a computer via the USB interface. On the internal 2.8″ display, we are limited to a fixed number of 101 scan points per calibration curve. If you measure a wide band (for example, from 1 to 30 MHz), the step between individual points is too large and you can easily miss a narrow resonant peak or a sharp filter cutoff. Computer programs elegantly circumvent this limit using the segment scanning method – they divide the desired band into dozens of smaller sections, gradually request data from the device and combine them into one detailed curve with thousands of points.
Two software tools dominate the amateur radio world:
NanoVNA-Saver
This open-source software written in Python (originally authored by Rune B. Broberg) is the absolute global standard for NanoVNA data analysis. It offers an extremely sophisticated user interface with the ability to display a large number of graphs simultaneously (SWR, Smith chart, phase, group delay, polar graph, Return Loss).

Its greatest advantages include advanced and very accurate implementation of TDR for cable measurements, the ability to automatically calculate matching circuits (L-elements) directly for the measured antenna impedance, and convenient data export to Touchstone files (.s1p and .s2p) for amateur radio simulation programs. The software is fully multiplatform, running stably on Windows, Linux and macOS.
NanoVNA App
This program, whose code was optimized and developed by renowned amateur radio author Owen Duffy, stands out for its extreme rendering speed and minimal demands on computer system resources. Unlike NanoVNA-Saver, it is visually more minimalist and straightforward, but in terms of mathematical accuracy of data processing and advanced calibration algorithms it is highly appreciated by amateur radio purists.

It is ideal for fast, real-time interactive tuning where you need immediate, smooth graph response when trimming an antenna radiator or compressing a coil turn in a filter. Owen Duffy has integrated improved equations into his branch for accurate extraction of transmission line and RF balun parameters, consistently eliminating systematic measurement errors.
Practical measurement scenarios with NanoVNA-H step by step
To achieve relevant and accurate results, the instrument must be properly configured and a so-called OSLT calibration (Open, Short, Load, Through) must be performed before each important measurement for a precisely defined frequency range. The calibration moves the measurement reference plane from the inside of the instrument to the end of the connected coaxial jumpers (pigtails), completely eliminating their parasitic capacitance, inductance and attenuation. If you neglect the calibration, you will measure the properties of the cable and not the antenna itself.
Example A: Antenna tuning for the 80m band (Inverted V dipole) from 3.5 to 3.8 MHz
Procedure for measuring a wire antenna in amateur radio practice:
- Nastavenie rozsahu (Stimulus): Turn on the device, tap the screen to open the menu, and go to
STIMULUSFor the 80m band, select a wider range for clarity, so that you can see the antenna behavior outside the amateur radio band. SetSTART > 3.0 MHzandSTOP > 4.5 MHz. - Kalibrácia (CAL): Go to the main menu, select
CAL > CALIBRATE. To the end of the coaxial cable that will be connected to the antenna (or directly to the CH0 port), sequentially connect the calibration elements from the supplied set:- Pripojte OPEN (connector without center pin), press the button
OPENon the display (the text turns white or becomes highlighted). - Odpojte Open, pripojte SHORT (connector with shorted center), press the button
SHORT. - Odpojte Short, pripojte LOAD (precise 50 Ω non-inductive resistor), press the button
LOAD. - Since we are only measuring single-port (S11), press
DONEand select a memory location, for exampleSAVE 0Calibration is active, indicated by the letter C (Calibrated) on the left edge of the display.
- Pripojte OPEN (connector without center pin), press the button
- Pripojenie antény a konfigurácia zobrazenia: Connect the power supply of your Inverted V dipole to the CH0 port. In the menu
DISPLAY > TRACEactivate only the routes you need. For exampleTRACE 0set in the menuFORMATonSWR.TRACE 1set to formatSMITHLook at the SWR curve. - Interpretation and tuning: Move the marker with the upper toggle switch to the point where the SWR curve has the lowest value. If this minimum (resonance) is at 3.42 MHz, the antenna is too long. Look at the Smith chart - at the desired center frequency of the band (3.65 MHz), the marker will show a significant inductive component (+jX). Based on this finding, you know that you need to shorten (cut or bend) the arms of the dipole symmetrically. If the minimum were at 3.95 MHz, the antenna is short, has capacitive reactance (-jX) and the radiators need to be extended. The goal is to get the marker at 3.65 MHz as close as possible to the center line of the Smith chart (pure 50 Ω without reactance, SWR 1:1).
Example B: Low-pass filter (LPF) measurement at 144 MHz (2m band)


Procedure for measuring filter transmission properties:
- Nastavenie rozsahu: Since we are measuring a filter for the 2m VHF band, we need to see not only the passband, but especially the attenuation at the second and third harmonic frequencies. In the menu
STIMULUSset the frequency range fromSTART > 50 MHztoSTOP > 500 MHz. - Complete two-port calibration: Prejdite do
CAL > CALIBRATE. Perform the stepsOPEN,SHORTandLOADna porte CH0 presne tak, ako v predchádzajúcom príklade. Následne prepojte port CH0 a port CH1 priamo medzi sebou pomocou dvoch kvalitných tienených koaxiálnych prepojok a SMA samčej spojky (Through adaptér). V kalibračnom Menu stlačte tlačidloTHRU. The device will then measure and store the parasitic characteristics of the transmission link chain. PressDONEand save the configuration in positionSAVE 1. - Filter connection: Disconnect the center SMA connector and insert the low-pass filter under test between the jumper cables. Connect the filter input to the CH0 port (signal generator) and connect the filter output to the CH1 port (receiver/detector).
- Parameter evaluation: V menu
DISPLAY > TRACEactivate a route that is tied to a channelCH1 THROUGHand on the menuFORMATassign it to herLOGMAG(logarithmic amplitude, expressed in dB). Watch the curve on the display or in the NanoVNA-Saver program. In the 144–146 MHz passband, the curve should be almost at the zero line - the typical insertion loss (Insertion Loss) of a quality filter is up to 0.2 to 0.4 dB. Then move the marker to the frequency of 288 MHz (the second harmonic of the transmitter). Read the attenuation value here. A quality amateur radio filter should show a suppression of at least -40 dB to -60 dB in this area, which the NanoVNA-H, thanks to its dynamic range in this band, will allow you to accurately verify and, if necessary, optimize the filter by adjusting the turns of the filter coils.
Comparison with alternative versions and development branches of NanoVNA
The huge success of the original design and Hugen's revision of the NanoVNA-H inspired a whole family of related instruments. These versions differ in display size, mechanical construction, frequency range, and most importantly, the internal circuit architecture used. If you are considering a purchase, it is critically important to know the differences in order to choose the right instrument for your amateur radio needs:
NanoVNA-F and NanoVNA-F V2
The version marked with the letter "F" (created by BH5HNU) brings visible changes at first glance. It has a significantly larger, 4.3-inch IPS display and a robust aluminum instrument chassis, which is mechanically much more durable than the sandwich construction of two printed circuit boards in the classic NanoVNA-H model. The manufacturer has integrated a more massive battery with a capacity of up to 5000 mAh, which allows for all-day work on the mast without the need for recharging.
The newer generation, NanoVNA-F V2, completely changes the internal architecture and extends the frequency range up to 3 GHz. It is built on the SAA-2 design, so it no longer uses the harmonic components of the Si5351A. It is ideal for radio amateurs who, in addition to HF, require work on the 23 cm (1296 MHz) and 13 cm (2320 MHz) microwave bands.
SAA-2 / NanoVNA V2 and V2 Plus4
This is a completely redesigned hardware architecture developed in collaboration with the community around the original design. This device no longer uses the harmonic components of the Si5351A chip for signal generation, which suffered from higher noise. It works on the principle of two independent frequency synthesizers with quadrature mixers, which allows native and high-precision measurements in the range from 50 kHz to 3 GHz (high-end revision V2 Plus4 up to 4.4 GHz).
A huge advantage is the preservation of high dynamic range (around 70-80 dB) even at frequencies above 1 GHz, which is crucial for the development and tuning of equipment in the UHF/SHF bands. The disadvantage compared to the NanoVNA-H version is a slightly higher price, higher current consumption from the battery and a slightly more complex interaction via the built-in menu without a connected PC.
Lithuanian
The current absolute king in price/performance ratio for microwave enthusiasts. LiteVNA is built on the foundations of the NanoVNA V2 architecture, but thanks to the implementation of modern switched mixers and improved filters, it can reliably and stably measure in the range from 50 kHz to an incredible 6.3 GHz. The device is produced in versions with both 2.8″ and 4″ displays.
It covers the complete amateur radio spectrum, including the 6 cm (5.7 GHz) band, and is an absolute dream for enthusiasts of satellite operation via geostationary satellite. QO-100 (Qatar-OSCAR 100) or builders of high-speed amateur radio networks Hamnet. The dynamic range at high frequencies is excellent, the device is compact and fully compatible with modernized versions of the NanoVNA-Saver software.
Price, availability and identification of verified versions

NanoVNA-H is one of the most affordable and widely used measuring instruments in the history of radio electronics. However, thanks to the open open-source license, a huge number of anonymous factories began to produce it on the Asian market, which led to a flood of low-quality clones. These cheap plagiarisms often save in the wrong places – they lack shielding covers over the RF part, use low-quality SMA connectors with high attenuation, do not contain diodes to protect the ports from static electricity from antennas, or have batteries with half the capacity without protection circuits.
To ensure the declared parameters, linearity, stability of the internal VCTCXO oscillator and one hundred percent support for future firmware versions, it is strongly recommended to purchase only original revisions from Hugen.
- Kde bezpečne zakúpiť: The device is commonly available from reputable European amateur radio distributors, such as the French e-shop Passion Radio, which is the official authorized seller of verified Hugen hardware versions. Alternatively, the purchase can be made directly through Hugen's official store on the AliExpress platform.
- Price: It ranges from €50 to €70 depending on the specific seller, the presence of a protective plastic case (ABS enclosure) and the composition of the supplied accessories. The standard factory packaging includes the NanoVNA-H device itself, a set of three gold-plated calibration SMA elements (Open, Short, Load), one Through adapter (SMA female-female), two flexible coaxial pigtails of type RG174 or RG316 with pressed SMA male connectors, a stylus for precise control of the touch menu and a USB-C cable for connection to a PC.
- Identification (SKU): An original Hugen product bears a type designation associated with its official distribution network and has clearly structured descriptions on the printed circuit board, including the hardware version (e.g. revision 3.4 and later).
Why NanoVNA-H should not be missing in a modern hamshack

The NanoVNA-H has started a technical revolution. For the price of one average coaxial relay or two connectors, a licensed radio amateur gets a device that covers 90% of common hamshack measurement needs. The ability to see complex impedance, work with a Smith chart, measure filter parameters on two gates, and locate cable faults using a TDR makes this tiny device an invaluable assistant.
Whether you are a hardcore HF operator building directional Yagi and Quad antennas, or a portable enthusiast who needs to quickly check the state of the art before the contest begins, the NanoVNA-H represents an investment with the highest possible amateur radio added value. Combined with powerful software like NanoVNA-Saver, it will take your understanding of high-frequency technology to a whole new level.
Meranie s NanoVNA má aj svoje úskalia, práve pre využívanie meraní on harmonických syntézy. Moje NanoVNA má on výstupe pre základný signál 145Mhz -15dBm, 3H 435MHz má -26dBm, 5H má -31dBm. Toto koreluje aj s dynamikou uvádzanou v tabuľke. Harmonické sa používajú aj pre zmiešavač. Pri meraní hlavne aktívnych obvodov, ktoré nemajú dostatočnú selektivitu „ on vstupe“ to môže výrazne ovplyvniť výsledky merania, napríklad prebudením meraného obvodu on 70cm od „základného“ signálu on 2m čo má o 11dB viac ako „meraný“ signál on 70cm.
Ak antenna rezonuje aj na 3 či 5 harmonickej, čo je napríklad dipól, tak vyššie harmonické tiež trochu „kecajú“ do merania, nie sú tu žiadne pasívne filtre, kompenzovať sa to snaží hlavne FW a dobrá kalibrácia pred meraním.
Okrem HW je pre NanoVNA dôležitý FW, kde sa vývoj „originálnej“ verzie od EDY555 zastavil pred 6 rokmi. Aktuálne je asi najlepší FW od DiSlord, ktorý doplnil do pôvodnej verzie desiatky nových meraní, Menu, ukladanie na uSD kartu, viac bodov, iné možnosti kalibrácie…
NanoVNA-H (a iné V1 HW) má ešte jednu výhodu pred vyššími verziami, dá sa pripojiť k a ovládať z android zariadenia, síce len základné merania, ale v teréne to dosť pomáha, veľký a na slnku dobre čitateľný Display mobilu, možnosť okamžitého zdielania výsledkov.
NanoVNA-H je taký švajčiarsky nožík do batohu, on bežné merania super. Cena ľudová ( on čo to vie až smiešna), ak sa VNA H rozbije, tak LCD je bežný za pár €.
A má najbližšie rozmermi a väzbou on ruku k handheldom, takže meranie antén pre „ručky“ on 6m a 2m asi najviac zodpovedá realite.
NZ Tono,
praktické postřehy, výrobce originál je firma Zeenko.
https://www.zeenko.tech/nanovna
and poslední HW verze jsou 3:6 and 3.7 vysvětleno zde.
https://nanovna.com/
FOR hamy, kteří nehovoří anglicky lze doporučit český web OK1UFC
https://sidlo.com/radiotechnika/index.htm
Jako majitel NanoVNA doporučuji ještě jeden zajímavý přístroj.
Spektrální analyzátor TINYSA
https://www.tinysa.org/wiki/
Dakujem za linky. Poznam ich ale mozu pomoct ostatnym.
TinySA ultra mam.
Tono