
V článku sa dočítate
Compact dashboard for WSPR propagation analysis
Pred každým QSO s DX stanicou sa rádioamatér pýta to isté: otvára sa teraz dráha? Na ktorom pásme? V akú hodinu UTC? These questions are answered by WSPRSpyDX – an open-source web application by Colin MM0OPX, designed primarily for quickly verifying historical propagation between two regions directly from your phone. The project is available at GitHub under the CC0-1.0 license without any restrictions on use. He wrote the application for his own use, but it may be useful for you too.
What is WSPRSpyDX
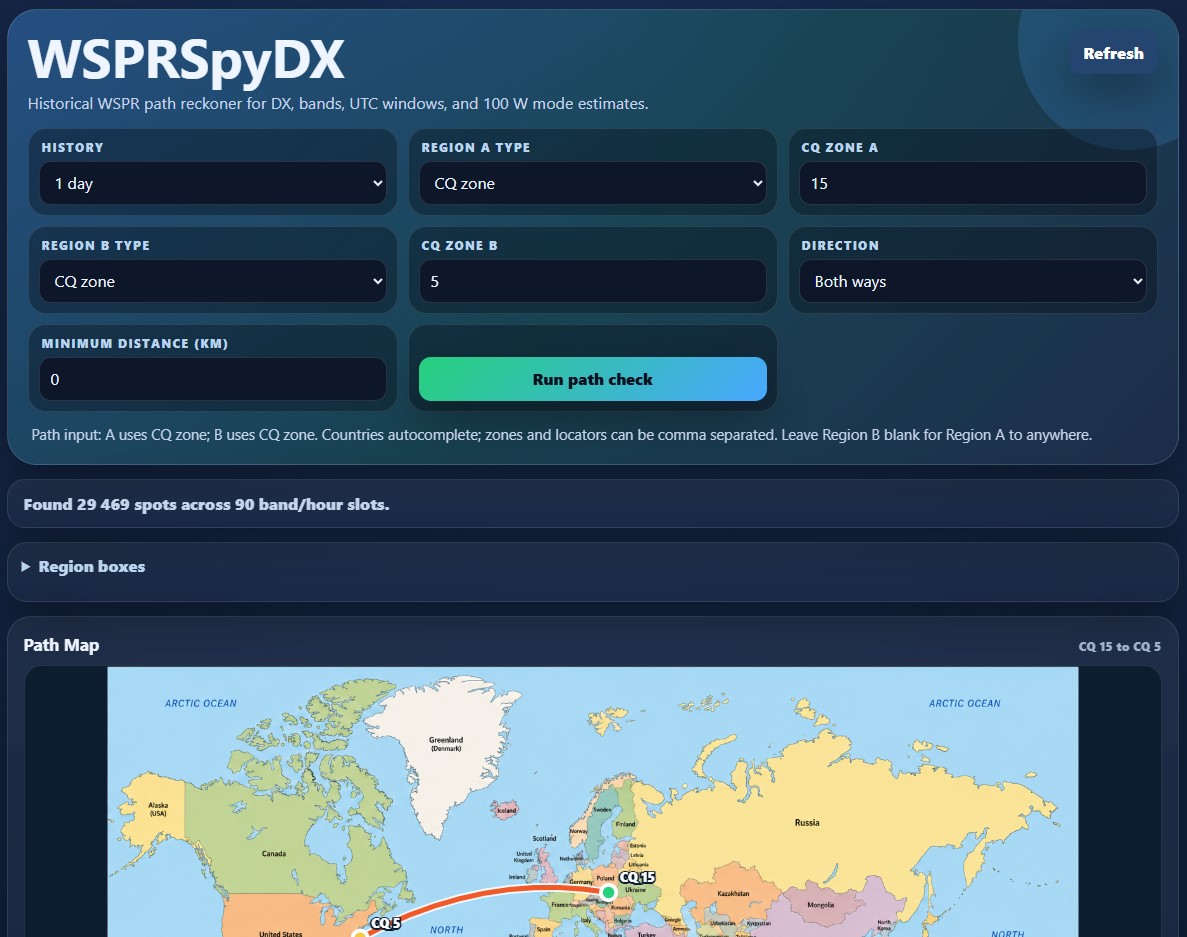
WSPRSpyDX is a compact DX path dashboard that uses a historical database of WSPR spots to evaluate the quality of propagation between two selected areas. The user enters Region A (e.g. a country or larger geographic area), optionally Region B, selects a time window for the history, and the application returns a summary: number of spots on the bands, best UTC windows for operation, SNR estimates, and indicators of suitability of FT8, CW, and SSB modes. The results are intended as a practical aid in decision-making, not as a deterministic prediction of propagation.
Region search supports five types: country or larger area, CQ zone, ITU zone, Maidenhead locator, and direct entry of geographic coordinates with editable fields for latitude and longitude. If Region B is left blank, the application will compare Region A against the entire world. Shortcuts for popular areas such as Scotland, New Zealand, the East and West Coasts of the USA, and others are also supported.
Launch on PC and launch on phone
WSPRSpyDX is a PWA (Progressive Web App) - it works like a static website without the need for a server with a database or backend. Running it on a PC is easy: just download the repository from GitHub and start a local HTTP server with the command python -m http.server 8790 --bind 0.0.0.0, then open http://localhost:8790/ in the browser. On a phone on the same WiFi network, just enter the LAN IP address of the computer. In the Chrome browser on Android, there is an Add to Desktop feature that installs the application as a separate icon without a visible browser bar.
For those who don't want to manage a local server, publishing via GitHub Pages is available - after uploading the repository, simply enable Pages for the main branch in the repository settings and GitHub will provide a public URL to the dashboard. Alternatively, there is a direct Android APK file, WSPRSpyDX-v0.39-debug.apk, in the releases folder, which wraps the same dashboard in a native Android WebView wrapper. This is a debug-signed build intended for testing; Android will warn about unknown sources upon installation, which is standard for this class of software.
UTC windows with number of spots
The key view of WSPRSpyDX is the UTC window table. For each band, it shows at which UTC hours spot activity has historically been recorded on the selected track. Clicking on a filled cell opens a detailed view with specific WSPR spots - showing likely countries, distances in km, SNR values in dB, transmitted power in dBm and an estimate of the equivalent SNR at 100 W. This 100 W equivalent allows spots from different WSPR stations with different powers to be compared on a common reference base.

The main minimum distance filter is used to filter the results, which filters out spots from nearby stations and leaves only the real DX paths. Separate distance filters are available for the Live Openings view and the CW RBN monitor, independent of the main setting.
Current distribution map – Live Openings
The Live Openings panel displays currently open tracks on a world map with colored lines by band. The map is bundled locally as a static PNG file - the application does not require loading tiles from external map servers and works fully even with slower mobile connections. A curved path corresponding to the actual geodetic path of the signal is displayed between the selected regions. In addition to the map, the panel displays hot bands - bands with the largest number of current spots - and hot countries, i.e. countries from which the highest spot activity comes. Each visible spot is rated by an estimated SNR at 100 W.

Green and red mode chips on each result provide quick visual information about the estimated suitability for FT8, CW and SSB based on the measured SNR. If the K-index from NOAA/SWPC has increased in the last 24 hours, the app will display a warning that current conditions may differ from the historical pattern.
CW RBN Monitor
In addition to WSPR data, WSPRSpyDX also includes a Reverse Beacon Network monitor for CW. The panel allows filtering by call sign, time window and minimum distance. The RBN monitor responds to current CW calls on the HF bands and complements the view from historical WSPR spots with live information on open paths in real time. The combination of both sources gives the operator a complete picture: the historical WSPR database indicates when the path was opened historically, and the RBN confirms or refutes the current status.
Data sources
| Source | Purpose |
|---|---|
| db1.wspr.live (ClickHouse) | Historical WSPR spots |
| wspr.live | WSPR Live project |
| reversebeacon.net | CW RBN spots in real time |
| NOAA/SWPC | Planetary K-index (JSON API) |
| Nominatim geocoding | Alternative country and region search |
CQ and ITU zones are not directly available as columns in the wspr.rx database, so the application converts them to practical geographic coordinate areas. The Maidenhead locator is converted directly from the specified value. The world map is bundled locally, so the application does not depend on external map tiles.
Summary
WSPRSpyDX fills a specific gap in the WSPR tool ecosystem: it is not another live spot viewer, but a historical path checker optimized for use on a phone. An operator who wants to know whether the runway to JA or W6 opens in the morning or evening, and on which band, will get the answer in a few seconds without having to interpret large map views. Open source code under the CC0-1.0 license, a local map without dependence on map servers, and Android APK support make it a practical tool for anyone who uses WSPR not only for their own reporting, but also for propagation analysis before the actual operation.