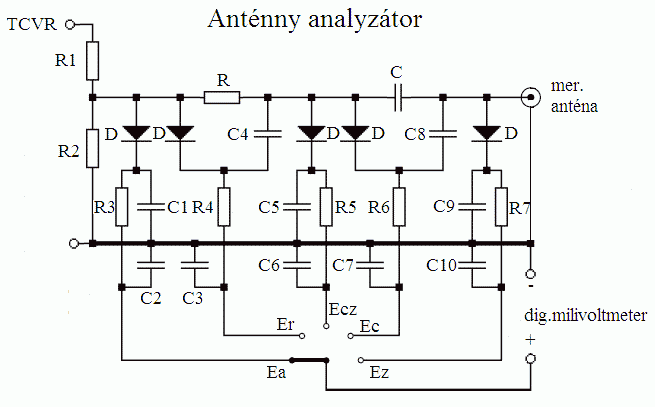
Anténny analyzátor je pre rádioamatérov, ktorý preferujú doma vyrobené antény výborným pomocníkom. Umožňuje „nahliadnuť“ do vlastností antény tým, že zobrazuje jednotlivé zložky impedancie. Z týchto údajov vieme určiť impedanciu, PSV aj rezonančnú frekvenciu. Ceny komerčne vyrábaných anténnych analyzátorov sú väčšinou nad možnosti našich rádioamatérov. Zhotoviť anténny analyzátor pritom nemusí byť vec zložitá ani nákladná.
V článku sa dočítate
Princíp anténneho analyzátora
Základom je VF generátor s riaditeľným výstupným výkonom, čo môže byť aj bežný transceiver. Je výhodné, ak je odblokovaný aj na vysielanie mimo rádioamatérskych pásiem, čo umožní merať antény v širšom rozsahu frekvencií. Nezbytným doplnkom je merací jednoduchý merací prípravok spojený s milivoltmetrom. Namerané hodnoty budeme spracovávať na počítači.

Na meranie zložiek impedancie sa využíva mostíková metóda. Toto zapojenie publikoval už v roku 1965 Doyle Strandland W8CGT v americkom QST. Výhodou je, že je jednoduché a nemá žiadne nastavovacie prvky.
Vhodné je nastaviť napätie z generátora (TCVR-a) na vyššie, aby sme minimalizovali vplyv charakteristiky použitých diód. Ak je napätie len v stovkách mV (= výstupný výkon je príliš malý), je možné zmeniť hodnoty rezistorov vo vstupnom deliči, ktorého úlohou je oddeliť (potlačiť) pôsobenie nevhodných impedancií (impedancie odlišné od 50 ohm), ktoré neprispôsobená anténa môže predstavovať.
Na meranie napätí je potrebné použiť milivoltmeter alebo digitálny multimeter s vysokým vstupným odporom. Nie každý multimeter je vhodný na prácu vo VF poli v blízkosti antény, najmä lacnejšie multimetre ukazujú nezmyselné hodnoty.

Požiadavky na konštrukciu
Celá konštrukcia mostíka musí spĺňať podmienky VF techniky, t.j.vývody všetkých súčiastok skrátime na minimum a súčiastky musia byť kvalitného prevedenia. Rezistory vo vstupnom deliči sú najnamáhanejšie výkonom, preto ich treba patrične dimenzovať, ale zároveň musia mať minimálnu vlastnú indukčnosť. Preto je naznačené aj paralelné spojenie dvoch rezistorov pomerne netradičnej hodnoty. Vhodné je, ak tento delič od zvyšku mostíka stienime, napríklad prepážkou z kuprextitu. Rezistor R postačí dimenzovať na pätinu vstupného výkonu. Kondenzátory použijeme kvalitné, najmä kondenzátor C, ktorý je vo vetve mostíka. Jeho kapacita je určená frekvenciou, na ktorej meriame.
| Frekvencia | 3,5 MHz | 7 MHz | 14 MHz | 21 MHz | 28 MHz | 50 MHz | 144 MHz |
| Kapacita | 1000 pF | 560 pF | 390 pF | 180 pF | 100 pF | 49 pF | 22 pF |
Reaktancia kondenzátora je približne 50 ohm na každej frekvencii, ale presná hodnota nie je nutná, ani nemá vplyv na presnosť merania. Len v prípade veľkých rozdielov (pod 25 a nad 100 ohm) sa znižuje presnosť merania. Na vyšších frekvenciách (nad 10 MHz) nie je vhodné použiť prepínač kapacít ani výmenný systém kondenzátorov.
Anténu pripájame priamo na svorky mostíka, alebo cez opakovač impedancie (koaxiálny kábel dlhý Lambda/2 x skrac.činiteľ).
Spracovanie nameraných výsledkov

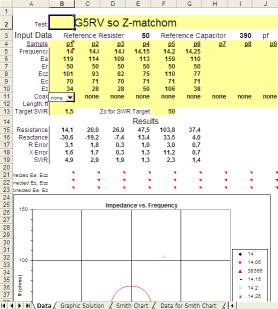
Medzi prednosti Joeovho makra okrem zvýšenia presnosti patrí grafické zobrazenie výsledku a to aj v Smithovom diagrame.

Makro je dostupné na Joeovej stránke http://www.QSL.net/n8xpv/index.html. Práca s ním je pomerne jednoduchá.
Praktický príklad merania antény G5RV so Z-matchom na 20m pásme. Anténa je v pracovnej výške pripojená koaxiálnym káblom (opakovač impedancie). TCVR prepneme na CW (alebo FM), zakľúčujeme a v polohe prepínača „Ea“ nastavíme výkon tak, aby napätie bolo niekoľko voltov. Zapíšeme napätie do tabuľky, alebo priamo do makra (UFB možnosť, napríklad v notebooku, hneď po meraní vidíme výsledky). Odmeriame a zapíšeme aj ďalšie napätia (Er, Ecz, Ec a Ez). Odkľúčujeme a TCVR preladíme na ďalšiu frekvenciu, napr. O 50 kHz vyššie a celý postup opakujeme. Výsledkom je tabuľka R a jX (aj so znamienkom), možná nepresnosť vyplývajúca z meracej metódy, PSV, graf závislosti impedancie od frekvencie a Smithov diagram.
Rozpis súčiastok
| R1 | 7,5 ohm (2×24 a 1×21 ohm paralelne, viď .text) |
| R2 | 21 ohm (viď .text) |
| R3 – R7 | 1M |
| R | 50 ohm (2×100 ohm paralelne) |
| C1 – C10 | 1000pF styroflex, keramika, sľuda a pod. |
| C | viď .tabuľka |
| D | BAT46 (alebo iné schottkyho VF diódy) |
Literatúra
[1] Peter Dodd G3LDO, Tom Lloyd G3TML: Measurement of antenna impedance, SPRATč.50, jar 1987
[2] http://web.ukonline.co.uk/g3ldo/
[3] http://www.qsl.net/n8xpv/index.html
[4] Jan Bocek OK2BNG, Ing.Tomáš Klimčík: Elektrotechnické měření (11), Měření komplexní impedance antény, RŽ 2/2002
[5] Peter Dodd G3LDO: Antennas, RadCom 7/2005
