Autorom seriálu článkov o príjme meteo snímkov NOAA je Ondro (zawin), pôvodný článok nájdete na www.svetelektro.com. TNX!
V tejto prvej časti sa budem venovať problematike satelitov NOAA, ktoré využívam na prijem meteorologických snímkov zeme. Zameriam sa na ich rozdelenie, vlastnosti, kódovanie dát, moduláciu a vysielacie frekvencie. V dalších článkoch sa budem venovať anténe na príjem NOAA satelitov a samotný príjimač z hladiska charateristiky a konštrukcie.
Dúfam že vás daná problematika zaujme a rozšíri vaše obzory elektrotechniky 🙂
Rozdelenie a príjem satelitov
Oblasť satelitov ktorá ma zaujala sú tzv. WXSAT (Weather satelit – satelity pre sledovanie počasia). Tieto satelity možno rozdeliť do 2 základných skupín:
– Geostacionárne – svoju polohu vzhľadom na Zem nemenia (METEOSAT 7, GMS-5,GOES-E …)
– orbitálne satelity s polárnou dráhou – sú v pohybe vzhľadom na Zem (NOAA, Meteor a ďalšie..)
Predmetom môjho záujmu sa stala skupina NOAA (National Oceanic and Atmospheric Administration). Tieto satelity sa pohybujú na polárnych dráhach okolo Zeme vo vzdialenosti 800 až 1200km, prelietavajú nad tým istým miestom denne približne v tú istú hodinu. Pri každom oblete zeme prechádzajú blízko okolo severného a južného poľa – odtiaľ pochádza názov polárne. Doba obletu celej zemegule je približne 102 minút.
Presnú dobu preletu nad danou lokalitou môžeme určiť výpočtom z „kepleriánskych prvkov“, ktorými je popísaná aktuálna dráha zvoleného satelitu. Na výpočet preletu a aktuálnu polohu satelitov dnes slúži rada programov na PC. Ja sám používam najradšej program Orbitron vo verzii 3.71 (obr č.1). Zobrazuje aktuálnu polohu satelitov a dokáže aj predpovedať ich najbližšie oblety, ďalej určiť či bude satelit pri prelete osvetlený alebo nie a mnoho iného.
Obr. č.1: Ukážka programu Orbitron
|
Pri vysielaní dát zo satelitov NOAA neobsahuje v našich zemepisných šírkach žiadny začiatok ani koniec. Vysielanie prebieha po celú dobu preletu satelitu. Najskôr, keď sa satelit objaví na obzore , je okraj prijímaného snímku zašumený a postupne signál rastie. Na konci, keď satelit zapadá za horizont postupne signál slabne až sa úplne stratí. Dĺžka trvania preletu nad našou lokalitou trvá približne 10min.
Aktívne NOAA satelity ktoré vysielajú data na frekvencii 137MHz sú v súčastnosti 4 – NOAA-15,NOAA-17, NOAA-18,NOAA-19. O tom, že tieto satelity sú potrebné aj v súčastnosti nás presvečil posledný satelit NOAA-19 ktorý bol spustený 6. Februára 2009.
Vysielacie frekvencie satelitov sú nasledovné:
NOAA 15 137.50 MHz
NOAA 17 137.62 MHz
NOAA 18 137.10 MHz
NOAA 19 137.9125 MHz
Pri vysielaní dát zo satelitov NOAA neobsahuje v našich zemepisných šírkach žiadny začiatok ani koniec. Vysielanie prebieha po celú dobu preletu satelitu. Najskôr, keď sa satelit objaví na obzore , je okraj prijímaného snímku zašumený a postupne signál rastie. Na konci, keď satelit zapadá za horizont postupne signál slabne až sa úplne stratí. Dĺžka trvania preletu nad našou lokalitou trvá približne 10min.
Modulácia a formát dát
Vysielanie snímok z NOAA satelitov sa skladá z riadkov trvajúcich 0.5 sekundy, zodpovedajúcej s údajmi snímačov. Tie poskytujú jeden snímok zemského povrchu obsahujúce dáta z dvoch kanálov. Na kanále A sa vysiela snímok vo viditeľnej časti spektra (VIS) a na kanále B snímku v infračervenej časti (IR). Každý riadok obsahuje dáta z oboch kanálov (časový multiplex) a skladá sa zo sekvencie oddeľovacích tónov preložených moduláciou snímky.
Dátam v kanále A predchádza krátky pulz 1040 Hz a podobne dátam v kanále B predchádza krátky pulz 832 Hz. Každý riadok obsahuje aj kalibračnú sekvenciu. Vďaka tomu dokáže potom používaný SW pre dekódovaní zobraziť iba vybraný typ snímky alebo snímku zosynchronizovať na okraj obrazovky.
Polárny satelit používa moduláciu typu APT a geostacionárny WEFAX. Tieto metódy kódovania sú si veľmi podobné. Jediný podstatný rozdiel je v tom, že príjem z polárneho satelitu nemá žiadny začiatok ani koniec, prenos signálu na Zemi je nepretržité. Signály budeme prijímať vo forme čiernobielej obrazovej informácie (pseudo-zafarbenie prebieha až v PC), štandardným audio kanálom, kde zmena amplitúdy subnosnej 2400Hz vyjadruje úroveň jasu. Maximum modulácie subnosné je definované ako amplitúda označená číslom 8 na stupnici šedi, čo zodpovedá (87 ± 5)% (nesmie prekročiť 92%) modulácie a zodpovedá bielej farbe na snímke. Takto vzniknutý AM signál sa ďalej namoduluje na hlavnú nosnú v pásme 137 až 138MHz (pásmo FM).
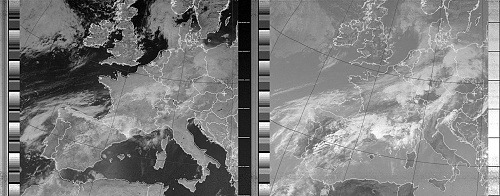
Formát APT: Formát snímky APT je na obr.2 a je tu možné vidieť oba kanály A aj B, rozdelenú na 16 dielov, ktoré slúžia na kalibráciu snímky. Každý diel je zložený z ôsmich za sebou nasledujúcich obrazových riadkov. Poznamenajme teda, že diely 1 až 14 sú identické na snímkach z oboch kanálov. Na obr. 3 vidieť už tento formát APT „v praxi“, tak ako som ho prijal zo satelitu 🙂
Obr. č.2: Formát APT
|
Obr. č.2: Formát APT v praxi
|
Zdroj: www.svetelektro.com


