
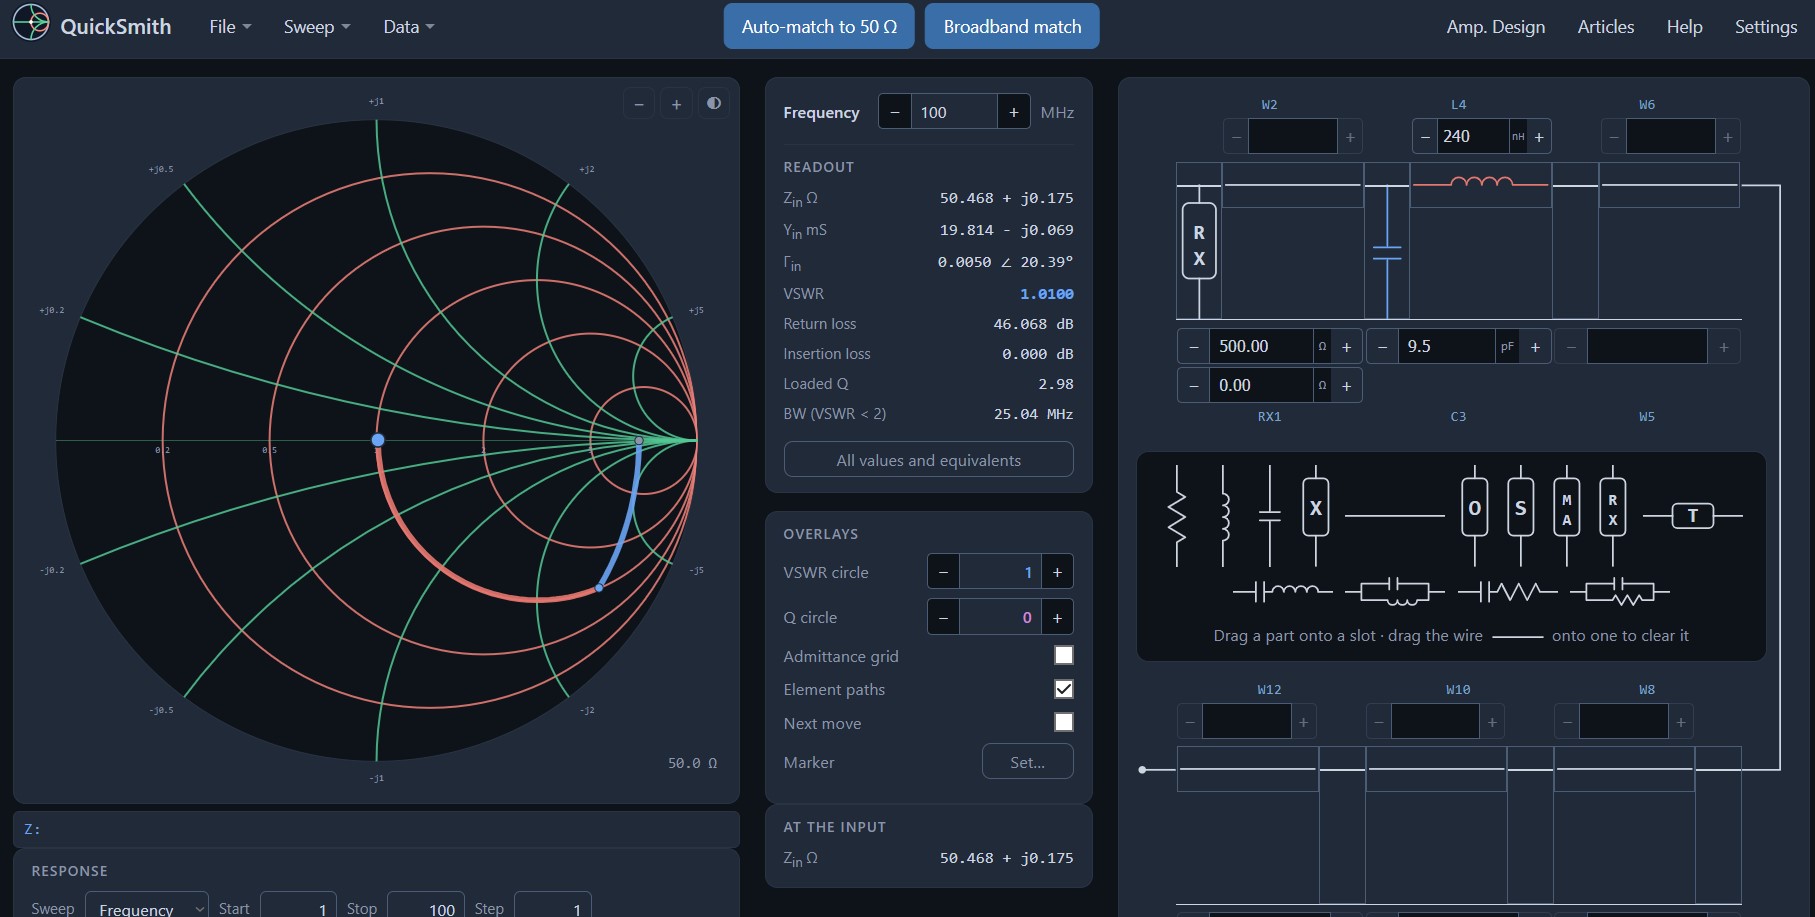
Smith's diagram is familiar to almost every radio amateur who has ever adjusted an antenna. However, fewer of us work with it every day. Circles, arcs and standard impedances on paper look intimidating, although the idea behind them is simple: to show how each component shifts the impedance. That's where QuickSmith comes in, a free Smith chart that runs right in your browser.
No need to install anything. You open the page quicksmith.online, you drag the part onto the diagram and immediately see where the point on the diagram moves. And if you have at home nanoVNA, you can also load your own measurements into the program.
You will read in the article
What is QuickSmith and where does it come from
QuickSmith is a Smith diagram simulator for building ladder networks. In addition to the customization itself, it handles frequency sweep or component value, amplifier design, and microstrip and coaxial line calculations. It is free and open-source.
The program is nothing new. The first version was created in 1993 for Windows 3.1. It moved to the website in 2017 and underwent a complete rebuild in 2026. Over the years, he also found his way into professional literature. Harold Kinley, WA4GIB, devoted a 2010 two-part article "Using QuickSmith" to it in QEX magazine and mentions it in his book The Radioman's Manual of RF Devices, Principles and Practices. In Japan, Katsumi Ooi, JA5COY, included it on CD with his antenna and tuning books from CQ Publishing. RF Cafe lists it among the Smith Chart tools since the 1990s.
First steps
After opening the page, you see a Smith diagram on the left and a diagram on the right. At the left end of the diagram is the load, that is, the device you are measuring, such as the antenna at the end of the analyzer cable. At the right end is Zin, the input impedance that the program displays.
The work is really simple. You drag, for example, a resistor from the parts tray to an empty slot above or below the ladder. Slots that will accept the part will be highlighted as you drag. The program will ask for the value and the point on the diagram will move immediately. If you want to clean the slot, you drag the wire over it.
The default units are natural for a radio amateur:
- frequency in MHz,
- resistance and reactance in ohms,
- inductance in nH,
- capacitance in pF,
- line length in electrical degrees. You can set inches, millimeters or wavelengths in Settings.
You enter the load by dragging the RX chip to its slot, then you enter it as R + jX. You enter it as a size and angle with the MA chip. You can then rewrite the values directly in the fields. You can change the step of the arrows by double-clicking on the value field or by clicking and pressing the S key. The FAQ recommends a coarse step for zooming in and a fine step for fine-tuning. You return the error via Ctrl+Z, on Mac ⌘Z.
Adaptation to 50 Ω
The principle is the same as on the paper diagram. You enter the load and operating frequency and add components until the point reaches the center of the diagram. First you get to the circle that passes through the center, and with the last part you move along it to the center.

If you don't know which direction to go next, turn on the Next move overlay. It shows the shortest route to the destination and is continuously updated. You can also tune each part by dragging directly on the diagram. The program calculates a value that moves the point under the cursor, while the part moves along its circle of constant resistance or conductivity. It is an excellent tool for understanding what a series coil or parallel capacitor actually does.
Auto-match

If you don't want to search manually, press the Auto-match to 50 Ω button in the middle of the menu. The program lists all two-element networks that reach the characteristic impedance at a given frequency, including component values and loaded Q. They are ordered from lowest Q. If you specify the desired Loaded Q, the Pi and T cells will be added. Until you use any of the networks, nothing changes.
Do you need a system other than 50 Ω? You can change the characteristic impedance in Settings, or place a target mark on the diagram and adjust to it.
You can see the result in the data column next to the diagram: Zin, Yin, reflection coefficient Γ, PSV, return loss, insertion loss, loaded Q and bandwidth for PSV less than 2. You can find other values and equivalents under the option "All values and equivalents".
Analyzer measurement and wideband matching

Pre rádioamatéra je to azda najzaujímavejšia funkcia. Cez Data → Open Measurement you load Touchstone files (.s1p, .s2p and similar) that it exports for example NanoVNA, or custom .gam format. You can use the measurement as a load, in which case the program interpolates it in the entire frequency range, or as a comparison curve. If you don't have the measurement right now, the program also contains sample measurements.
After loading the measurement, the Broadband match button will appear. The program tries six topologies and does not look for the best average but the best worst PSV in the entire band. At the same time, it will show the theoretical limit according to Bode-Fan and suggest bands that are worth trying. For an antenna that you want to adapt to the entire band and not just to one frequency, this is exactly what you need.
Sweep and response plot
You set the sweep range in the Response panel and plot it in the diagram via Sweep → Generate. You can sweep the frequency or value of any of the twelve elements. The curve is automatically redrawn every time the circuit changes.
The response graph on the main page shows the insertion loss and S21 over the sweep range, including the effect of mismatch. If the colored arcs of the components start to bother you when sweeping, you can turn them off with the Element paths option in the Overlays panel.
Wiring and design of amplifiers
Through Data → Microstrip and coax, you can convert the line impedance to the width and length of the microstrip according to the properties of the substrate, or to the diameter of the inner conductor of the coaxial cable. After use, the design switches to millimeters, but only if all lines have the same shortening factor.
More advanced users will find the Amp window. Design. It offers source and load Smith charts with stability, gain and noise circles, so you can find the compromise between gain and noise figure. S-parameters of the transistor are entered manually or read from the Touchstone file.
Save, share and export
QuickSmith offers several ways to not lose a draft:
- Save Session saves one design in the browser,
- Saved Designs stores multiple named designs locally,
- save the .sch file permanently on your computer,
- Copy Share Link creates a link that restores the entire design, including parts and overlays.
The share link is especially useful when you want to send a proposal to a colleague or post it in a forum. However, designs with a loaded measurement create longer links. You export the diagram as a PNG image or vector SVG suitable for printing. You export sweep data to CSV with impedance, PSV and return loss, or to Touchstone format.
Mobile, tablet and feedback
QuickSmith also works on phone and tablet. The layout adapts to the screen, all twelve slots remain available, you drag the parts with your finger, and you enlarge the diagram by spreading two fingers. On narrow screens, the schematic moves below the diagram. The only thing missing from the touchscreen is the data under the cursor.
Chyby a nápady môžete poslať cez Help → Send feedback, which will open an email with your circuit attached as a link. Another option is the issue tracker on GitHub. You can find the source codes in the repository QuickSmith-Web. These are static files without translation, so just download them and open index.html directly in your browser.
Where to learn more
If you are just getting started with the Smith chart, open Help → Guided examples. The wizard guides you step by step through the finished designs. You can find written versions including examples of amplifiers under Examples in full. In the menu File → Open Design, two sample designs are also prepared: a manually adapted dipole and a low-pass filter.
For those who want to know the theory behind the calculations, the FAQ recommends this reading:
- Phillip H. Smith's book on the Smith Chart,
- HP Application Note 970,
- Guillermo Gonzalez's book on microwave amplifiers,
- articles by Harold Kinley in QEX.
Try QuickSmith
QuickSmith combines simplicity with features you wouldn't expect from a free web tool. A beginner can visually check on it what a coil or capacitor does with impedance. An experienced designer will load the measurement from the NanoVNA into it and have a broadband adaptation designed. The whole list of questions and answers can be found on the program page. However, it is best to simply open it quicksmith.online and drag the first part onto the diagram.