
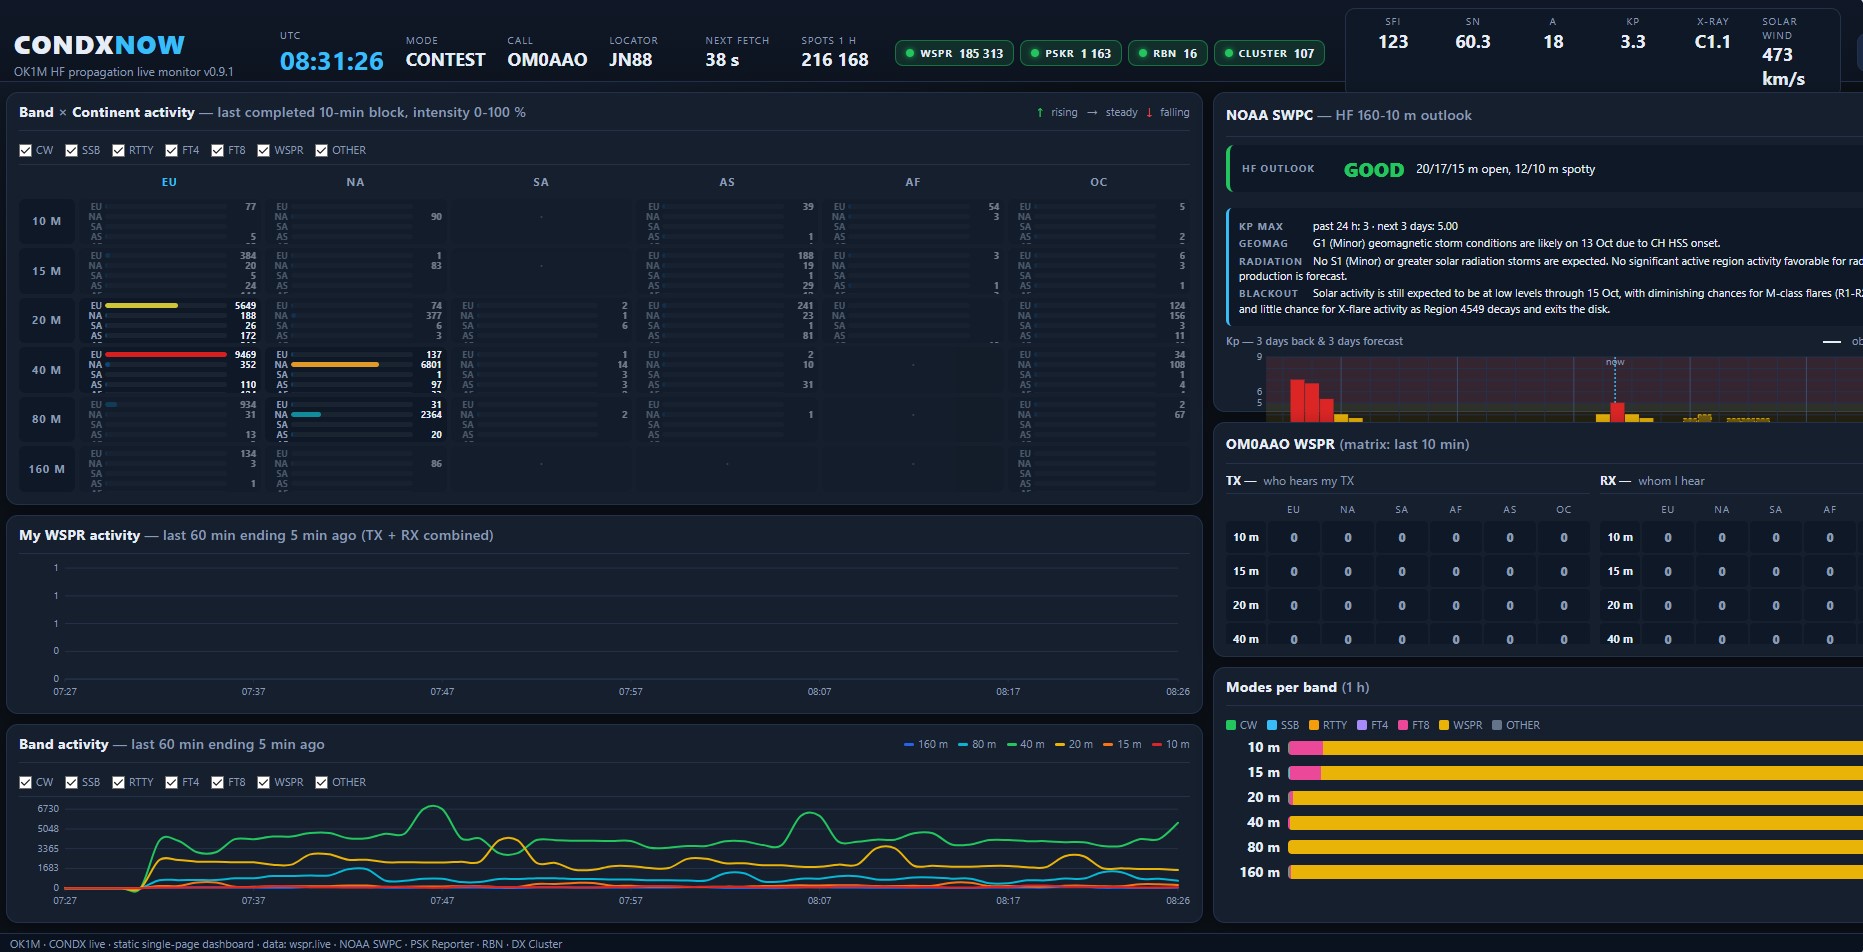
CONDXNOW (OK1M HF propagation live monitor, verzia 0.3) je jednostránkový dashboard, ktorý ukazuje aktuálne podmienky na rádioamatérskych pásmach. An important difference from classical forecasts: CONDXNOW does not predict the spread from a model, but is based on what is currently being received. It counts the spots and uses them to create a picture of where the bands are open.
The main advantage of the application is the joint display of several types of information on one screen. the operator does not need to open the solar index graphs, the digital connection map and the DX cluster separately. CONDXNOW provides a quick overview of the status of the bands, continental activity and the development of the number of captured signals. It is not a substitute for a physical model of propagation, but a practical monitor of current activity.
You will read in the article
Two modes: DX and CONTEST

DX Mode answers the question of where to tune in for new DX now. It shows a continent × continent matrix with a band breakdown, trend arrows (↑, →, ↓) against the hourly average, a list of recent DX sorted by distance, and solar context: SFI, SN, Kp, A, X-ray, and solar wind.
CONTEST mode locks the bands to the classic race set of 160, 80, 40, 20, 15 and 10m and asks which band to sit on right now. According to the version 0.3 entry, CONTEST is the default mode.
In DX mode, you choose the bands freely, in CONTEST they are fixed. The practical reason is clear: there is no point in watching the 12m and 17m bands in the race, because they are not contested.
Solar and geomagnetic activity in one place
The top part of the interface shows basic data about the state of space weather. These include SFI solar flux, SN sunspot number, Kp-index, A-index, X-ray class and solar wind speed. The data help put the observed activity on the bands into a wider context.
The solar flux at a wavelength of 10.7 cm, also referred to as F10.7, is one of the indicators of solar activity and is related to the ionization of the ionosphere. With increased solar activity, the conditions on the higher KV bands may be more favorable, but the result also depends on the time of day, the season and the specific route of the connection.
The Kp-index expresses global geomagnetic activity at three-hour intervals, while the A-index provides a summary view of geomagnetic conditions. Increased geomagnetic activity can disrupt propagation especially at higher latitudes and worsen conditions on some routes. The X-ray radiation class, on the other hand, draws attention to the intensity of solar flares, which can affect the daytime ionosphere on the illuminated side of the Earth.
However, none of this data by itself determines whether a particular station will be audible on 14 or 28 MHz. Their importance lies in the combination with current reports, the operator's own income and experience.
Continental Matrix and Band Activity Overview
The central element of the interface is the activity matrix, which compares continents and individual KV bands from 160 to 10 m. It shows the number of reports in the last completed time block, the distribution of activity by bands and the trend against the longer average. Color highlighting helps quickly identify areas where activity has increased.
In practice, this overview is useful for finding open routes. If, for example, the number of reports between Europe and North America increases to 20 m, the operator has a reason to verify the situation with his own receiver or to follow other DX spots. The matrix also allows you to compare activity on 15 and 10 m with lower bands. Such a comparison is particularly useful for daily operation planning and for monitoring band transitions during changes in ionospheric conditions.
The interface includes filters for operating modes including CW, SSB, RTTY, FT4, FT8 and WSPR. Thanks to this, the activity of individual types of operation can be better distinguished. However, it should be taken into account that the number of reports also affects the number of active stations, the power used, antennas and the location of receiving nodes. Therefore, a higher number of spots does not automatically mean a better chance of connection in each traffic category.
Charts, WSPR and race usage
The activity graph of the bands shows the evolution of the number of reports in the time window of the last 60 minutes. The operator can thus monitor whether the activity on a particular band is increasing, decreasing or remaining approximately stable. In conjunction with the continental matrix, it helps in deciding whether to stay on the current band or try a different one.
A special section of the interface shows the WSPR activity of the own brand. It distinguishes between transmissions picked up by other stations and signals received by one's own station. For experimenters and QRP enthusiasts, this is a valuable addition, as WSPR allows propagation to be observed even at very low powers. If the number and geographical distribution of reports changes after changing the antenna, power or band, the operator will get additional information to evaluate his workplace.
Počas pretekov je dôležitá rýchlosť rozhodovania. Režim CONTEST focuses on the classic set of bands 160, 80, 40, 20, 15 and 10 m. In combination with data from Reverse beacon network can help detect CW station activity and compare the situation between bands. In DX operation, tracking activity between continents and recent DX spots is useful.
Data sources and their limitations
CONDXNOW obtains data from several independent services. WSPR.live provides a database of WSPR reports, PSK Reporter collects reception reports of digital modes, and the Reverse Beacon Network records signals picked up by a network of receiving stations, especially CW skimmers. DXHeat provides activity data from DX clusters. Space weather data comes from the NOAA Space Weather Prediction Center.
Each source describes a different part of radio amateur activity. WSPR is good for tracking the spread of weak signals, PSK Reporter shows where digital broadcasts have been picked up, and RBN helps track station activity in CW operation. DX spots, in turn, capture activity reported by operators. Their combination offers a broader picture than a single database, but does not guarantee the completeness or faultless accuracy of all records.
The results depend on the availability of the individual services, the delay of the messages and the coverage of the receiving network. Therefore, the absence of spots does not necessarily mean that the band is closed. It is also true that the captured signal does not yet guarantee a successful two-way connection.
Deployment and customization options
The project is designed as a lightweight one-page web application. The basis is HTML, CSS and JavaScript files, so there is no need for a complex application server to display the interface. The application is primarily intended for clear display on a monitor in a radio amateur workplace, ideally in full screen mode. When used locally, it can also be served from a simple HTTP server.
For access to some resources, especially PSK Reporter, RBN and DXHeat, the project includes an auxiliary proxy server. In the repository, the script proxy.php is prepared for the environment with PHP, as well as proxy.py, which allows local execution without additional Python libraries. Without a properly configured proxy, some resources may be limited or unavailable; basic data from WSPR.live and NOAA can also be used separately.
The source code is publicly available in the repository git.ok1kvk.cz/RybkaLabs/condxnow. It is not a standard open-source license, but a free use without formal conditions.
CONDXNOW is a handy addition to the usual tools for monitoring DX traffic and propagation conditions. The greatest benefit comes when the data from the matrix, graphs and solar panel are used as an orientation basis and then verified by own income, current spots and operational experience. For both the contest operator and the QRP experimenter, it can thus represent a useful overview of what is currently happening on the KV bands.