Setting up the SSB audio chain using EQ, spectrum analysis and signal monitoring
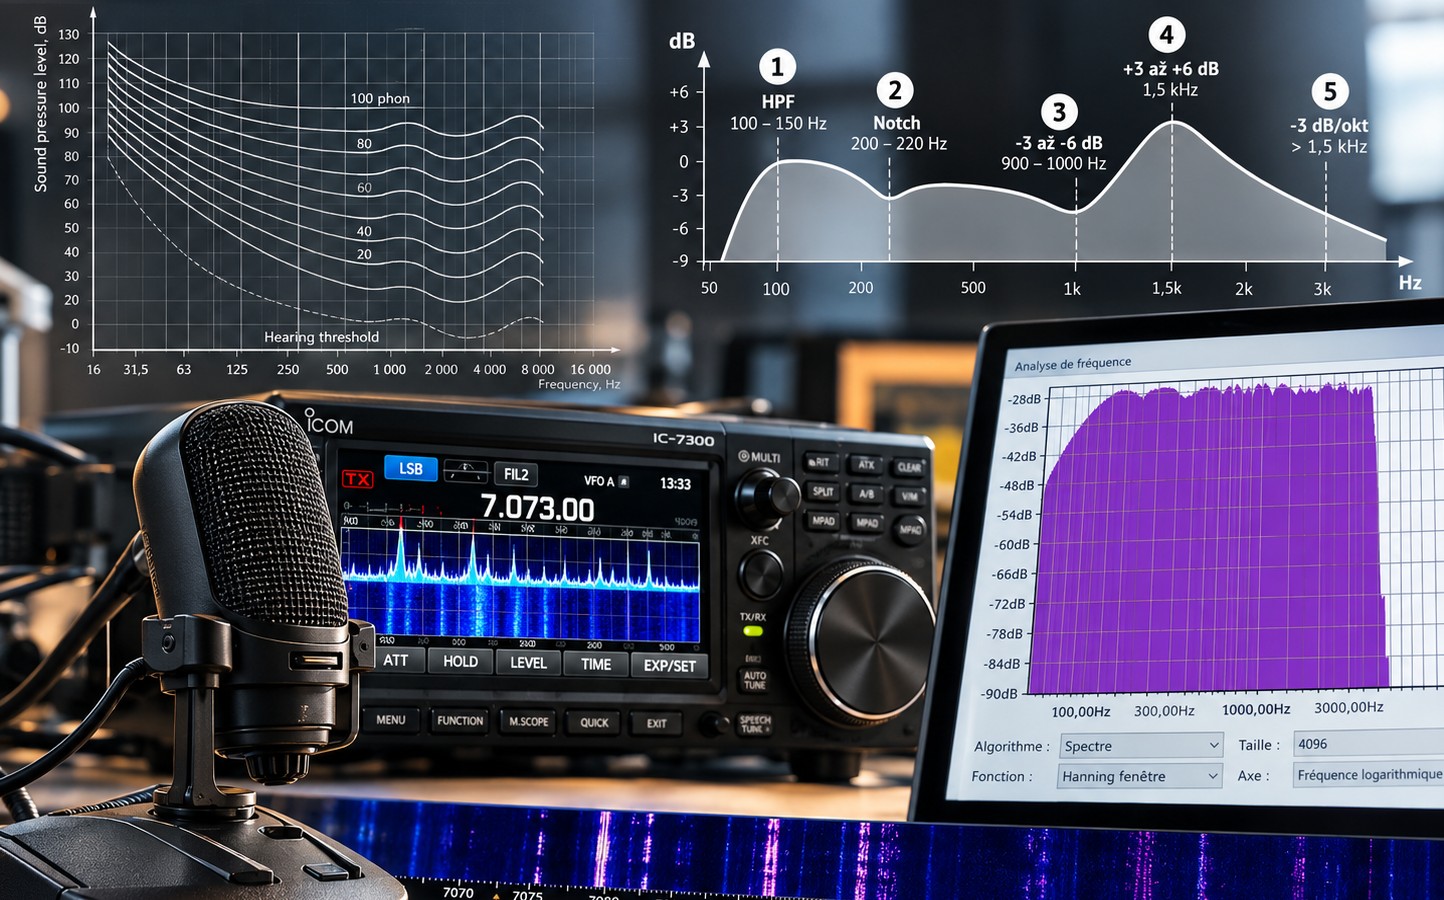
Nastavenie nízkofrekvenčnej cesty pri vysielaní jednopásmovou moduláciou (SSB) je často podceňovaným faktorom, ktorý zásadne ovplyvňuje zrozumiteľnosť a dosah signálu. Most radio amateurs adapt the sound to intuition or listening through headphones, which leads to inefficient use of high-frequency power. Kľúčom k profesionálne nastavenému SSB signálu je pochopenie psychoakustiky ľudského sluchu, predovšetkým of the ISO 226 standard, which defines equal volume curves (originally known as Fletcher-Munson curves).
The human ear does not perceive all acoustic frequencies equally. Its sensitivity is non-linear and depends on the sound pressure level. The human hearing apparatus reaches its highest sensitivity in the band from 1 kHz to 4 kHz, while at low frequencies below 300 Hz, it needs significantly higher acoustic energy to achieve the same subjective loudness. While commercial radio broadcasting has an audio bandwidth of up to 20 kHz, classic shortwave SSB operation is strictly limited to a channel width of 2.4 kHz to 3.0 kHz. In this narrow band, misdistribution of acoustic energy causes loss of intelligibility and wasted peak power envelope (PEP) of the transmitter power stage.
You will read in the article
Frequency profiles: Easy Listening versus maximum efficiency
When setting the equalization of the SSB transmitter, it is necessary to select an operating target. From the point of view of the acoustic spectrum, we distinguish two basic profiles: a profile for comfortable listening (Easy Listening) and a profile for maximum modulation efficiency intended for contest and DX operation.
New desktop microphone Icom SM-J1
Easy Listening profile
The Easy Listening profile is designed for regular local sessions and ragchewing with strong S9+20 dB signals. Its characteristic feature is a natural, pleasing sound without acoustic fatigue of the listener. In spectral analysis, there is a difference of about 20 dB between the bass peak (the first octave of the voice, typically 150 Hz to 220 Hz) and the suppression in the 900 Hz to 1 kHz region. This distance preserves the natural color of the voice, but the bass components consume a significant part of the total PEP power.
Profile for maximum efficiency
On the contrary, a profile for maximum efficiency is essential when working in conditions of limited power (QRP, SOTA), with directional antenna limitations or in demanding contest interference. The goal is to compress this spectral difference towards 0 dB and create a flat spectral characteristic close to white noise. A high-frequency amplifier has a fixed peak power limit. If strong bass frequencies enter the modulation path, they will drive the output stage to peak prematurely. By dropping the dominant bass, the available PEP power is spread evenly across the entire 300 Hz to 2700 Hz passband. On the receiver side, both the digital signal processor (DSP) and the operator's ear can decode a very weak signal even below the noise level.
Technical means for shaping the audio signal
SunSDR2 radio station and MFJ antenna tuner
Shaping the frequency response requires appropriate tools in the audio chain. In modern SDR TCVR, such as SunSDR2 Pro, Yaesu FTDX series, Kenwood TS-890 or Icom IC-7300, multi-band parametric equalizers (Parametric EQ) and digital speech processors are available directly in firmware zariadenia.
For older TCVRs or when advanced modifications are required, external radio amateur audio processors (W2IHY 8-Band, UR6QW, I1WSM) or studio 19-inch rack circuits containing Neve 1073 mic preamps, EQs and multiband compressors. Correct impedance and level matching is critical when wiring. The microphone input on the transmitter's front panel operates at low milliVolt levels and requires galvanic isolation when using external power supplies to avoid ground loops and RFI (RFI) induction. The second option is to use the rear line input (ACC/DATA) or direct digital audio transmission via USB rozhranie a virtuálny audio kábel (VAC).
Methodology of objective measurement using Monitor and Audacity function
Relying when setting the modulation on your own listening in headphones directly from the transmitter is a methodological error. Internal acoustic binding through the bones of the skull distorts the perception of one's own voice. Subjective estimation needs to be replaced by objective spectral analysis.
Correct practice requires sampling the modulated signal using the transmitter's built-in Monitor function, which provides demodulated audio prior to final transmission, with the transmitter operating into artificial load not transmitting interference into the band. Alternatively, it is possible to use a secondary linear receiver of the SDRplay type with the internal AGC turned off and a flat frequency response. The sampled audio signal is fed to a computer where the free Audacity software performs spectral analysis using the Fast Fourier Transform (FFT). The Spectral analysis (Plot Spectrum) function is used in the Audacity menu with the FFT window size set to 2048 or 4096 points and the Hanning window filter. This will give you an accurate graph of the power spectral density in the range of 0 Hz to 4000 Hz.
Standardized test text for spectral analysis
Repeatedly saying the phrase "CQ contest" or counting into the microphone is completely inadequate for spectrum analysis. These short expressions do not contain the full range of vowels and consonants, giving a distorted picture of average voice performance.
In order to achieve reproducible results, it is necessary to use a continuous, frequency-rich speech lasting at least 30 seconds. In acoustic engineering, a standardized acoustic phrase is used to calibrate microphones: "Please orange, I insist that you remove the brown zipper from the blue microphone boom". In Slovak conditions, a full-fledged replacement is the fluent reading of a technical text that combines voiced and voiceless sounds. For each test recording, it is necessary to maintain the same distance of the mouth from the microphone transducer (typically 5 to 10 cm), the same speaking angle and a constant acoustic intensity of the voice.
Cyclic loop setup procedure and ALC control
Slightly poor quality SSB signal
The setting of the modulation path takes place in a cyclic algorithm. The first step is to record a 30-second speech sample via the Monitor function in Audacity. The second step is to generate the FFT spectral curve. The third step is to compare the measured curve with the target profile (ISO 226 or FLAT). The fourth step is the correction of parameters on the equalizer. This cycle is repeated until the measured spectrum corresponds to the desired shape.
The final setting of the microphone gain (mic gain) and the speech processor (Speech processor / Compressor) follows only after shaping the frequency curve. The key rule is the correct operation of the automatic gain control (ALC) circuit. The ALC indicator must move exclusively in the marked linear field at speech peaks. If the ALC circuit is awake, there is a hard limitation of the signal envelope. The result of ALC wake-up is not higher volume, but phase distortion, higher-order intermodulation products (IMD), widening of occupied bandwidth, and splatter that grossly interferes with stations on adjacent channels.
Practical rules for adjusting the frequency curve
When adjusting the equalizer for SSB modulation, specific electroacoustic rules for setting individual bands apply.
Five steps of adjusting the frequency curve for a more understandable SSB signal
The first step is to strictly cut sub-bass frequencies below 100 Hz to 150 Hz using a high-pass filter. These frequencies do not contribute to speech intelligibility, but cause unnecessary overloading of the PA stage and may contain 50 Hz mains hum or fan acoustic oscillations.
The second step is to cut out the second harmonic frequency of the fundamental tone of the voice using a narrow notch filter (Notch Filter). For a male voice, this second harmonic is typically in the range of 200 Hz to 220 Hz (for example, 216 Hz). Suppressing it removes the booming and unclear nature of the sound.
The third step is performing spectral suppression in the 900 Hz to 1000 Hz band. Suppressing this area eliminates the boxy and nasally colored tone of speech.
The fourth step is to create a slight lift at a frequency of 1500 Hz (1.5 kHz). This area is critical for the formation of formants responsible for the intelligibility of consonants.
The fifth step is to set a descending slope of approximately -3 dB per octave from 1500 Hz to the upper band cut (2700 Hz to 3000 Hz). The uncontrolled emphasis of highs above 2 kHz creates the impression of a sharp signal, but during prolonged listening, it causes significant hearing fatigue and, with incorrect phasing, increases the risk of peak awakening.
Signal verification in real operation and monitoring via WebSDR
Quality SSB signal
Requesting modulation reports from stations on the band does not provide objective data. The received report is subject to the characteristics of the speaker of the opposite station, the acoustics of its room and the set reception DSP filter.
The only independent way of verification in real propagation is the use of a network of KiwiSDR and WebSDR receivers located at different distances.
At low transmission power to a real antenna, record your own signal on a remote SDR receiver. Visualization on the spectrogram (waterfall) will immediately reveal whether the signal is spectrally clean, whether it does not exceed the passband of 2.7 kHz, and whether unwanted side products are not generated at the peaks. Importing the recorded audio file from WebSDR into the Audacity program and the subsequent spectral analysis will confirm whether the modulation has maintained the specified curve even after passing through the ionospheric channel and AGC circuits of the receiver.
Comparison of operating profiles of SSB modulation
Parameter / Property
Profile of Easy Listening (Ragchewing)
Profile Maximum Efficiency (Contest / DX / QRP)
Bass spacing / 1 kHz
About 20 dB
Close to 0 dB (flat characteristic)
Bandwidth (SSB)
2.7 kHz to 3.0 kHz
2.4 kHz to 2.7 kHz
Sub-bass filter (HPF)
Cut below 80-100 Hz
Strict cut below 150-200 Hz
900-1000 Hz band
Valley -6 dB to -10 dB
Corrected to the bass maximum level
1.5 kHz area
Moderate lift (+3 dB)
Aggressive boost (+6 dB) to stand out in the noise
Use of PEP performance
Part of the power bound in the bass
100% PEP distributed in the intelligible band
Operational purpose
Local sessions, S9+20 dB signals, comfortable presentation
„V moderných SDR TCVR, such as SunSDR2 Pro, Yaesu FTDX series, Kenwood TS-890 or Icom IC-7300, multi-band parametric equalizers (Parametric EQ) and digital speech processors are available directly in firmware zariadenia.“
V IC-7300 viacpásmový parametrický EQ určite nie je. TX Bass, TX Treble a TBW (šírka audio pásma). Ku tomu kompresor. Viac tam nie je 😉
ham
13 dni pred
Asi bude zadrhel v tom, ze ma kazdy jinak ladeny hlas. Marketing neco vymysli i pro psa a kocku, mozna i pro prasata. Okolo 200-300Hz je zakladni spektralni slozka muzskeho hlasu. Proc to kokoti vyrezavaji? Zase nekdo nezvany se snazi podstrkavat nove a nove „rules“ a osobni pozadavky ktere vyhovuji jen jemu.
Prosím Ťa, mohol by si mi povedať, aký prospech by z toho mal marketing a prečo ho vôbec spomínaš?
Nielen každý hlas, ale aj každý mikrofón má inú charakteristiku, inak môžu byť nastavené NF obvody, inak môže byť NF signál „posadený“ do priepustnej krivky MF filtra, ktorá taktiež môže mať zvlnenie, však? Takže aj ten istý človek s rovnakým zariadením a rovnakým nastavením, ale iným mikrofónom môže mať výslednú SSB moduláciu výrazne inú.
ISO 226 nehovorí o tom, že by si každý mal nastaviť moduláciu rovnako. Hovorí o tom ako dosiahnuť efektívne komunikačné nastavenie a prečo.
Na pásmach sa vyskytujú signály, ktoré hovorovo označujeme „slabo premodulované“, „zahuhňané“, „široké“, „úzke“ a podobne. Možno ak by dotyční mali vedomosti ako to nastaviť lepšie, tak by to aj tak spravili. Preto ma osobne mrzí použitie vulgarizmu v komentári. Budem rád, ak nabudúce prispeješ k diskusii odbornejšie a zdvorilejšie. Dík
wpDiscuz
3
0
We will be glad for your comments, please comment!x



„V moderných SDR TCVR, such as SunSDR2 Pro, Yaesu FTDX series, Kenwood TS-890 or Icom IC-7300, multi-band parametric equalizers (Parametric EQ) and digital speech processors are available directly in firmware zariadenia.“
V IC-7300 viacpásmový parametrický EQ určite nie je. TX Bass, TX Treble a TBW (šírka audio pásma). Ku tomu kompresor. Viac tam nie je 😉
Asi bude zadrhel v tom, ze ma kazdy jinak ladeny hlas. Marketing neco vymysli i pro psa a kocku, mozna i pro prasata. Okolo 200-300Hz je zakladni spektralni slozka muzskeho hlasu. Proc to kokoti vyrezavaji? Zase nekdo nezvany se snazi podstrkavat nove a nove „rules“ a osobni pozadavky ktere vyhovuji jen jemu.
Prosím Ťa, mohol by si mi povedať, aký prospech by z toho mal marketing a prečo ho vôbec spomínaš?
Nielen každý hlas, ale aj každý mikrofón má inú charakteristiku, inak môžu byť nastavené NF obvody, inak môže byť NF signál „posadený“ do priepustnej krivky MF filtra, ktorá taktiež môže mať zvlnenie, však? Takže aj ten istý človek s rovnakým zariadením a rovnakým nastavením, ale iným mikrofónom môže mať výslednú SSB moduláciu výrazne inú.
ISO 226 nehovorí o tom, že by si každý mal nastaviť moduláciu rovnako. Hovorí o tom ako dosiahnuť efektívne komunikačné nastavenie a prečo.
Na pásmach sa vyskytujú signály, ktoré hovorovo označujeme „slabo premodulované“, „zahuhňané“, „široké“, „úzke“ a podobne. Možno ak by dotyční mali vedomosti ako to nastaviť lepšie, tak by to aj tak spravili. Preto ma osobne mrzí použitie vulgarizmu v komentári. Budem rád, ak nabudúce prispeješ k diskusii odbornejšie a zdvorilejšie. Dík