Potrebujete vytvoriť mapu či analyzovať contestové spojenia? Mario DL4MFM vytvoril online nástroj, ktorý zobrazí mapu spojení z ADIF/Cabrillo/REG1TEST-Edi/STF (max. 2MB). Postup je nahrať denník cez http://tools.adventureradio.de/analyzer/ https://qsomap.cqgma.org/ADIF_to_Karte.php a nastaviť filtrujúce parametre ak chcete získať špecifický pohľad na údaje z denníka.
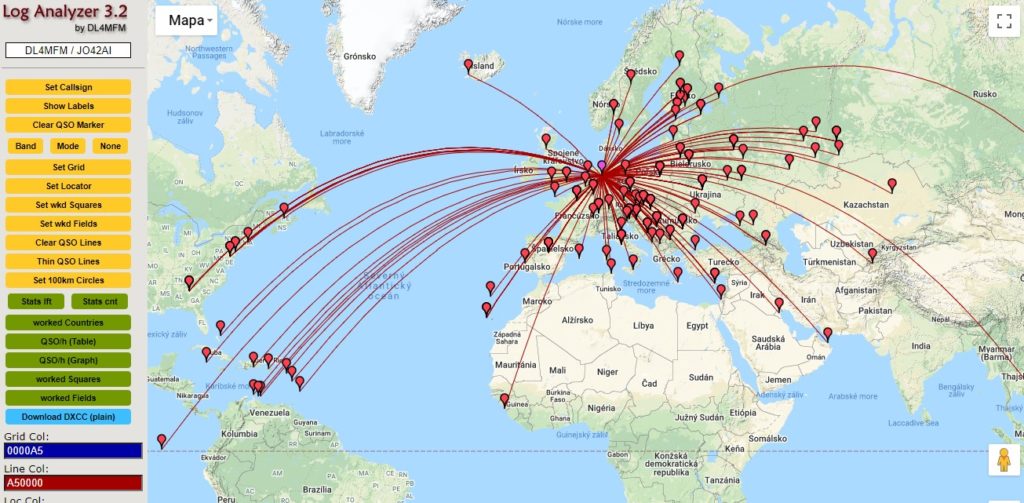
Podľa objemu dát sa potom vykreslí online mapa spojení. Skript zvláda aj veľký počet spojení, ale doba spracovania dát môže byť dlhšia, až 10 minút. Potom by skript zahlásil time-out. Ani by nemalo opodstatnenie zobrazovať mapu s tisíckami spojení – nedalo by sa v nej orientovať. Pre bežné počty spojení je však vykreslenie veľmi rýchle, zaberie len niekoľko sekúnd.
V ľavom stĺpci sa nachádzajú dizajnové nastavenia:

Práca s nastaveniami je intuitívna a výsledok ihneď v mape vidno. Ak sa nastavenie nepozdáva, opakovaným stlačením rovnakého tlačidla sa nastavenie zruší.
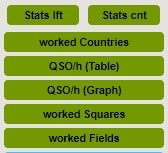
Inú farbu majú tlačidlá pre štatistiku:

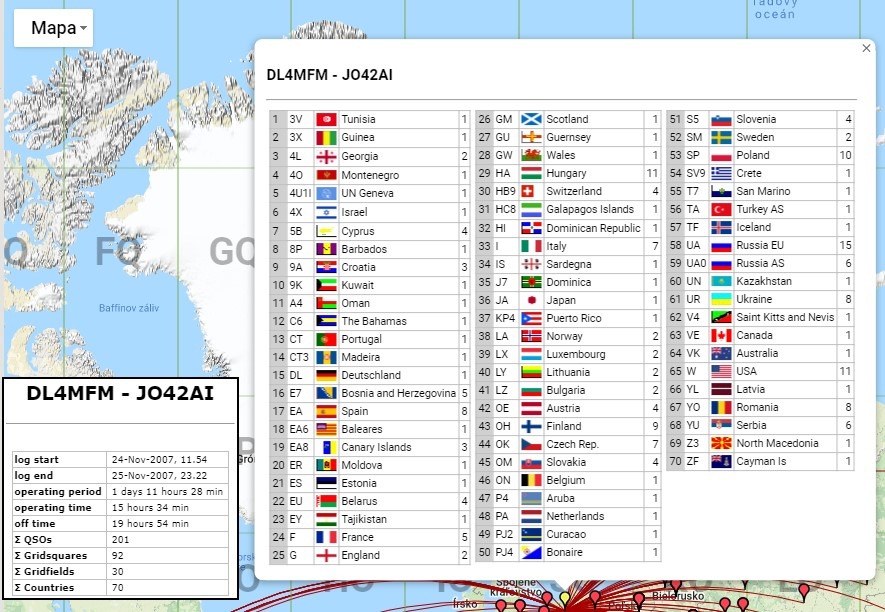
Sú to štatistiky pre KV aj VKV contesty. Tie sa v podobe okna zobrazia v mape, napríklad:

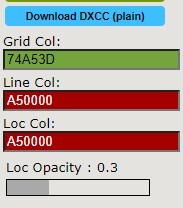
V spodnej časti stĺpca je možnosť exportu DXCC krajín a nastavenie farebnosti a priehľadnosti:

Ako online mapu a štatistiku Log Analyzera zdieľať či použiť vo svojej stránke? Sú dve možnosti:
- zdieľať URL mapy
- urobiť si screenshoty
Je na Vás, ktorý spôsob bude vyhovovať viac. Log Analyzer síce nie je úplnou novinkou, ale môže byť užitočným doplnkom.
